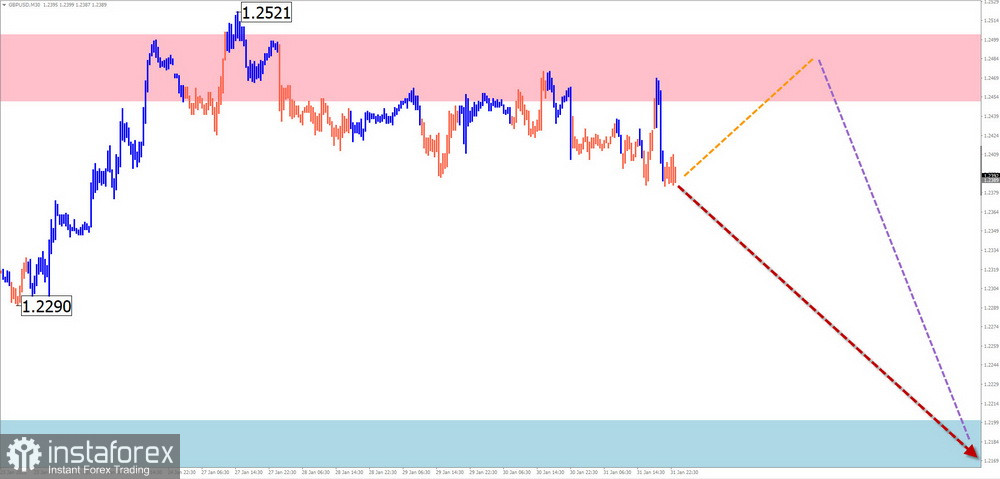
GBP/USD
Brief Analysis:The dominant bearish wave for the British pound, which began in August of last year, continues to develop through a corrective, shifting flat pattern that started two weeks ago. This wave structure remains unfinished at the time of analysis. The price is hovering around an intermediate large-scale reversal level.
Weekly Forecast:Expect the pound to continue its sideways movement within the price channel between opposing zones. After an attempt to test the resistance zone, a trend reversal is likely, with the pound potentially falling toward the support zone. The most significant activity is expected toward the end of the week.
Potential Reversal Zones:
- Resistance: 1.2450 / 1.2500
- Support: 1.2200 / 1.2150
Recommendations:
- Buy: Limited potential; risky.
- Sell: Possible with small volume sizes after confirmed reversal signals near the resistance zone.
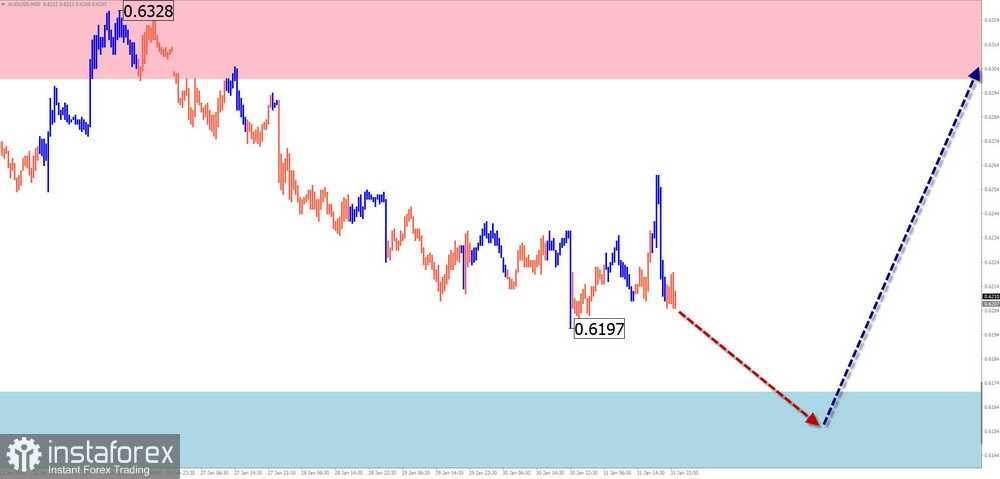
AUD/USD
Analysis:The unfinished bearish wave for the Australian dollar has been in motion since summer of last year. Since December, a corrective wave (B) has formed, with the price drifting sideways, creating an extended flat structure.
Forecast:Expect the price to decline toward the support zone early in the week, followed by sideways movement. A reversal and price recovery may occur closer to the weekend.
Potential Reversal Zones:
- Resistance: 0.6300 / 0.6350
- Support: 0.6170 / 0.6120
Recommendations:
- Sell: Possible with small volume sizes for intraday trades, until the first signs of reversal appear.
- Buy: Only relevant after confirmed reversal signals near the support zone.
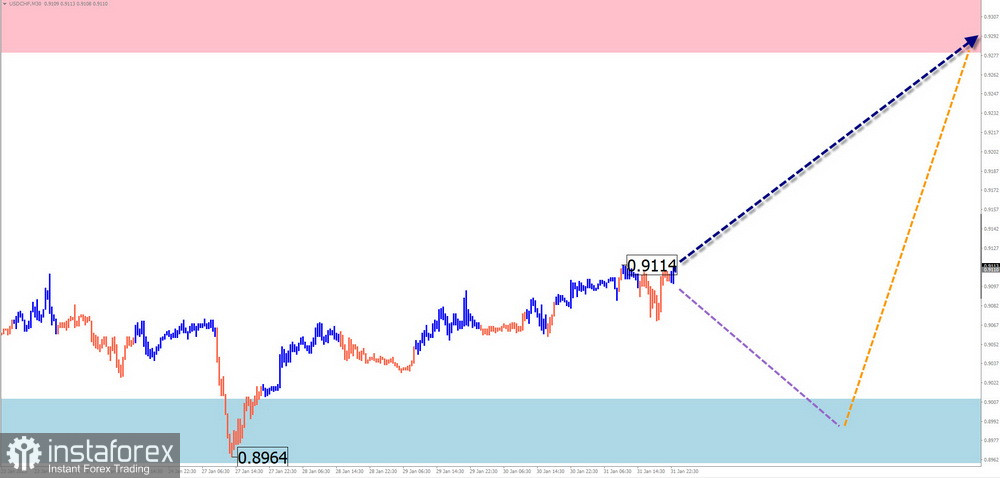
USD/CHF
Analysis:Since November 2022, the Swiss franc has been in an uptrend. The current wave began at the start of this year and is moving against the primary trend. Recently, the middle section of the wave has formed, with the upward movement since January 27 showing reversal potential.
Forecast:Expect a change in trend next week. After a potential decline to the support zone, the price may resume its upward trajectory, with a possible rise toward the resistance zone. Key economic events could coincide with market volatility.
Potential Reversal Zones:
- Resistance: 0.9280 / 0.9330
- Support: 0.9010 / 0.8960
Recommendations:
- Sell: Possible with small volume sizes during specific sessions.
- Buy: Becomes safer after confirmed reversal signals near the support zone.
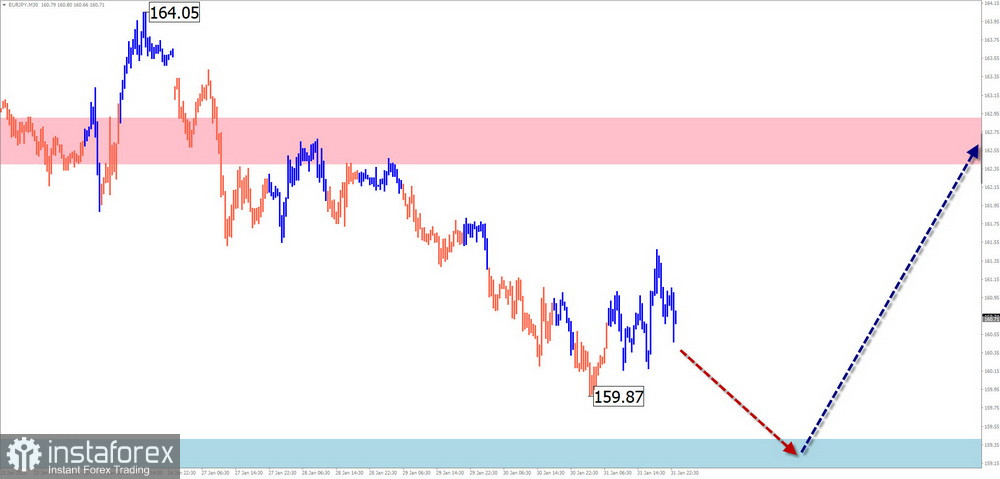
EUR/JPY
Analysis:The bullish trend in EUR/JPY began on December 2 of last year. Over the past two weeks, a bearish correction (B) has been developing, but the wave structure remains incomplete. The support zone lies along the upper boundary of a major potential reversal zone.
Forecast:Expect sideways price movement throughout the week. A temporary pullback toward the support zone may occur, but a reversal and price increase is likely afterward. Growth will likely be limited to the resistance zone.
Potential Reversal Zones:
- Resistance: 162.40 / 162.90
- Support: 159.40 / 158.90
Recommendations:
- Sell: Possible from the resistance zone during specific sessions; reduce volume size.
- Buy: Not relevant until reversal signals appear near the support zone.
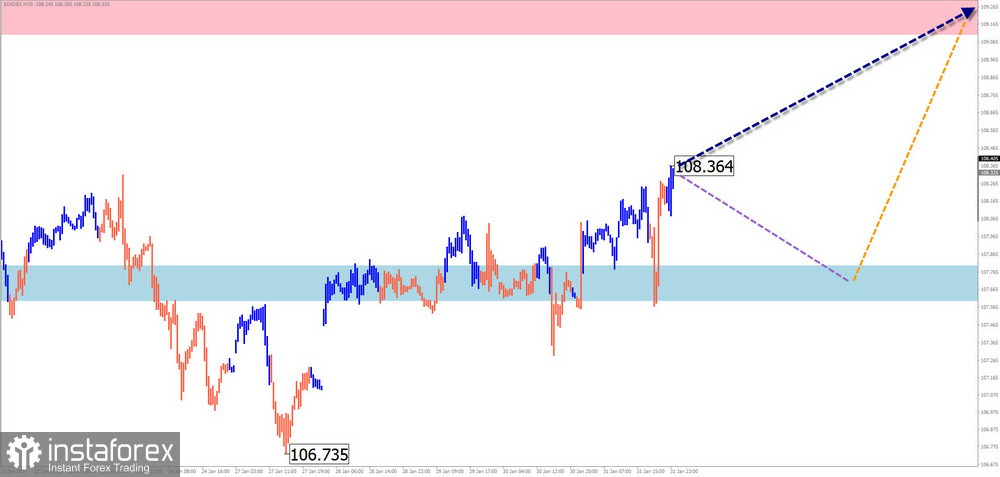
US Dollar Index
Brief Analysis:Since late September of last year, the U.S. Dollar Index has been following an upward wave algorithm. In the second half of the past month, the price drifted sideways, forming an unfinished extended correction. The wave structure remains incomplete.
Weekly Forecast:At the start of the week, expect sideways movement and a potential downward correction. A reversal may form near the support zone, followed by a resumption of dollar strength closer to the weekend.
Potential Reversal Zones:
- Resistance: 109.10 / 109.30
- Support: 107.80 / 107.60
Recommendations:
- Sell: USD counterparts in major pairs will become relevant after confirmed reversal signals appear near the support zone.
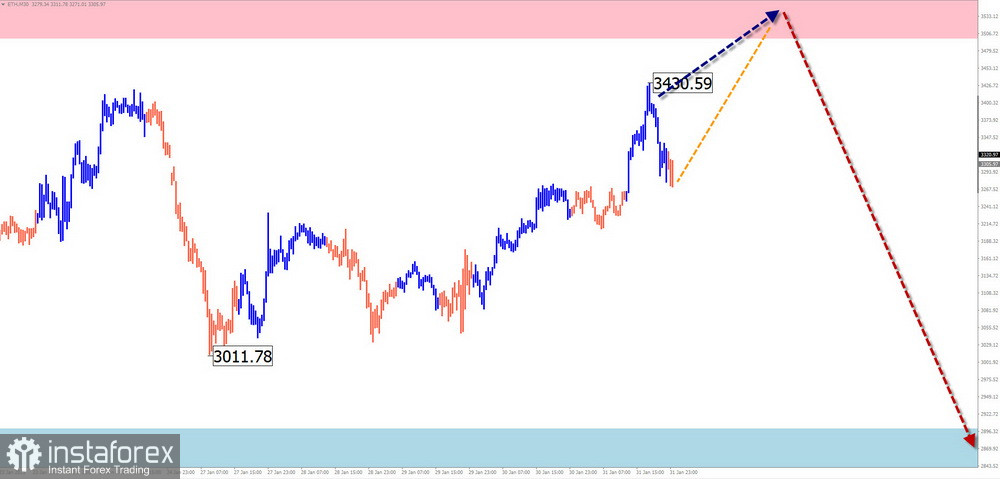
Ethereum
Analysis:The short-term trend for Ethereum has been guided by an upward zigzag wave that started in summer of last year. Since mid-November, the price has been in a correction phase, with the wave structure still incomplete. The price remains within a narrow range between strong opposing zones on higher time frames.
Forecast:At the start of the week, Ethereum may attempt to test the resistance zone. In the second half of the week, expect increased volatility and a gradual decline toward the support boundaries. A breakout beyond the calculated zones is unlikely this week.
Potential Reversal Zones:
- Resistance: 3500.00 / 3550.00
- Support: 2900.00 / 2850.00
Recommendations:
- Sell: Possible from the resistance zone during specific sessions; reduce volume size.
- Buy: Not relevant until confirmed signals appear near the support zone.
Explanations:
In Simplified Wave Analysis (SWA), all waves consist of three parts (A-B-C). The last unfinished wave is analyzed on each time frame. Dotted lines indicate expected movements.
Note: The wave algorithm does not account for the duration of price movements over time!