The EUR/USD currency pair traded with low volatility on Tuesday. There have been times when the euro would crawl just 40 pips a day, and while current volatility isn't extremely low, it's certainly not high either. The price has settled below the moving average—and, miracle of miracles!—it has remained below it for three days. As a result, the U.S. dollar has appreciated slightly over the past few days.
However, every trader understands that the dollar only strengthens within a modest corrective phase. The technical picture is contradictory if you try to piece together all the timeframes. According to classic technical analysis, one should start with the higher timeframes. So, let's look at the monthly chart—what do we see? A 16-year downtrend that shows no signs of ending. On the weekly chart—same story. There is also a downtrend on the daily chart, as the last downward wave was stronger than the previous and subsequent corrections. So, the three highest timeframes suggest that the dollar will continue to strengthen.
Of course, any trend eventually ends, but we keep returning to the same question: what could drive the euro to rise to $1.15 or even $1.25? After all, we're talking about global trends here, not 200-pip moves. And for a 1,000–1,500 pip rise, Donald Trump alone won't be enough. The euro needs broader growth drivers.
In recent weeks, the dollar's decline has been driven solely by "Donald Trump." Of course, the U.S. president can keep dragging the dollar down, primarily since it benefits him. However, this would mean the market will continue to ignore all factors except Trump's trade policy.
To recap, the U.S. economy began slowing in the fourth quarter of last year and will likely continue to slow in 2025. But even with that slowdown, it's still growing much faster than the European or British economies. The Federal Reserve has not cut rates and is unlikely to implement more than two rate cuts in 2025—an outcome far more hawkish than markets anticipated last year. Meanwhile, the European Central Bank might lower rates even below 2%. The ECB needs to stimulate the economy, whereas Jerome Powell claims there are no problems with the U.S. economy.
So, if not for Donald Trump and his radical, unconventional decisions, we would still expect the U.S. dollar to rise. However, the market continues to interpret fundamentals and macroeconomics through a one-sided lens. And we, in turn, must draw traders' attention to this obvious fact. The euro might continue to rise simply because anything is possible in the market. But there are no clear or compelling reasons for such growth.
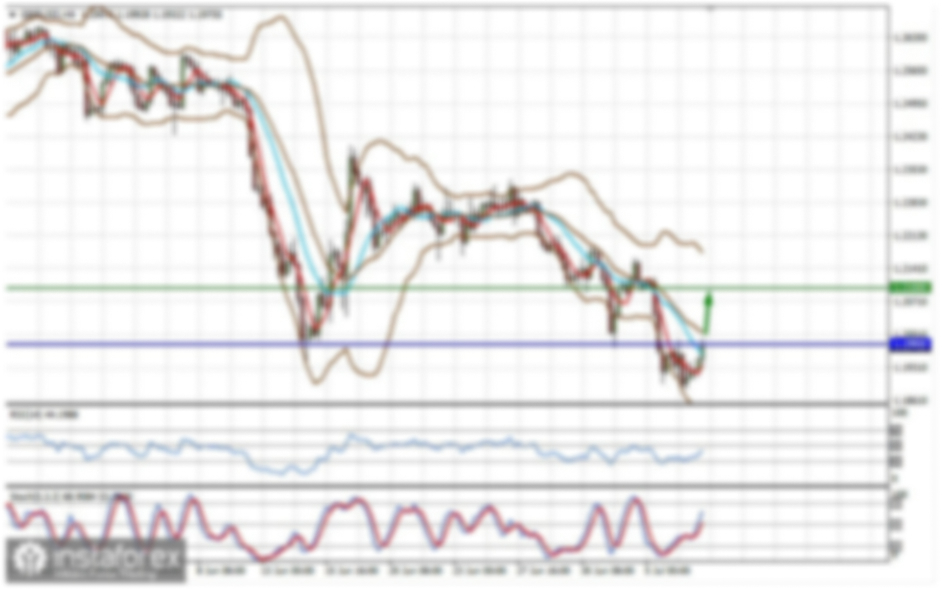
The average volatility of the EUR/USD currency pair over the last five trading days (as of March 26) is 77 pips, which is considered "moderate." We expect the pair to trade between 1.0732 and 1.0886 on Wednesday. The long-term regression channel has turned upward, but the global downtrend remains intact, as seen in higher timeframes. The CCI indicator has not recently entered overbought or oversold territory.
Nearest Support Levels:
S1 – 1.0742
S2 – 1.0620
S3 – 1.0498
Nearest Resistance Levels:
R1 – 1.0864
R2 – 1.0986
Trading Recommendations:
The EUR/USD pair has started a weak downward correction. For months, we've consistently stated that we expect a medium-term decline in the euro, and that view remains unchanged. The dollar still has no reason to fall in the medium term—other than Donald Trump. Short positions remain far more attractive, with targets at 1.0315 and 1.0254, though it is difficult to say when this irrational upward movement will finally end. If you're trading based purely on technicals, long positions may be considered if the price rises above the moving average, with a target of 1.0986.
Explanation of Illustrations:
Linear Regression Channels help determine the current trend. If both channels are aligned, it indicates a strong trend.
Moving Average Line (settings: 20,0, smoothed) defines the short-term trend and guides the trading direction.
Murray Levels act as target levels for movements and corrections.
Volatility Levels (red lines) represent the likely price range for the pair over the next 24 hours based on current volatility readings.
CCI Indicator: If it enters the oversold region (below -250) or overbought region (above +250), it signals an impending trend reversal in the opposite direction.