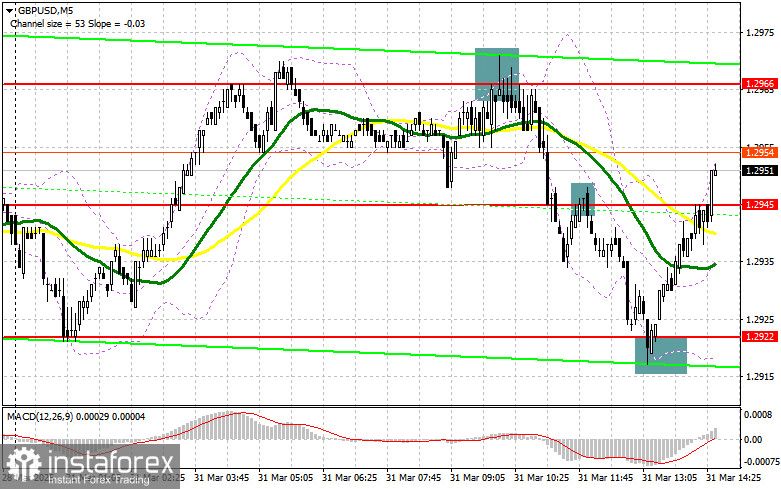
In my morning forecast, I focused on the 1.2966 level and planned to make trading decisions based on it. Let's look at the 5-minute chart and analyze what happened. A rise followed by a false breakout near 1.2966 provided a selling opportunity for the pound, resulting in a drop to the morning support at 1.2945. A breakout and retest of this range gave another signal to sell, leading the pair down to 1.2922, where pound buyers emerged. The technical picture has been revised for the second half of the day.
To open long positions on GBP/USD:
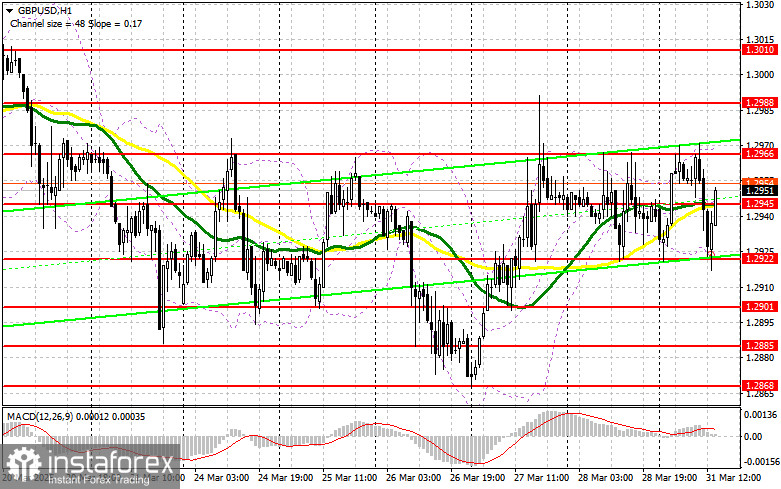
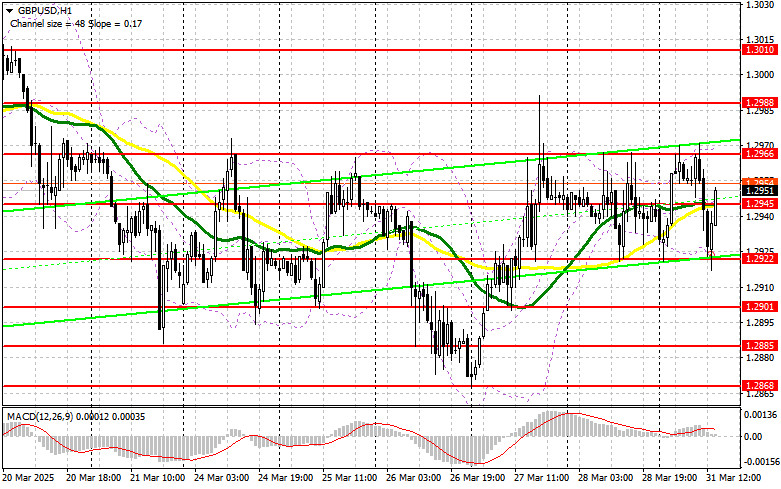
Weak lending data from the UK quickly brought pressure back to the pound, although such a sharp decline seemed unlikely. With no major stats ahead apart from the Chicago PMI, the market could easily react to new comments from Donald Trump regarding tariffs or statements from Federal Reserve officials, so be prepared. If the pair declines again, I prefer to act around the same 1.2922 support level as in the first half of the day. A false breakout there—similar to the earlier setup—will provide a good entry point for long positions with a target of recovering to the 1.2945 resistance. A breakout and retest of this level from top to bottom will give a new long entry point, aiming to retest 1.2966. The final target will be the 1.2988 area, where I plan to take profit. If GBP/USD falls and bulls show no activity around 1.2922 in the second half of the day, pressure on the pound will return at the beginning of the week. In that case, a false breakout near 1.2901 would be a good signal to go long. I also plan to buy GBP/USD immediately on a rebound from the 1.2885 support for a 30–35 point intraday correction.
To open short positions on GBP/USD:
Pound sellers acted right on time, bringing pressure back to the pair and significantly limiting the chances of continuing the bullish trend. If US data is weak and GBP/USD rises, only a false breakout at 1.2945 will offer a selling opportunity aimed at pushing the pair down to new support at 1.2922, where the moving averages—currently favoring the bulls—are located. A breakout and retest of this level from below will trigger stop-loss orders, opening the path to 1.2901, effectively negating buyers' efforts to regain control. The final target will be 1.2885, where I'll take profit. A test of that level will bring back a bearish market. If demand for the pound returns in the second half of the day and bears fail to show themselves at 1.2945, then it's better to postpone shorts until a test of the 1.2966 resistance. I'll only sell there after a false breakout. If there's no downside move even from there, I'll consider short positions on a rebound from 1.2988, but only aiming for a 30–35 point correction.
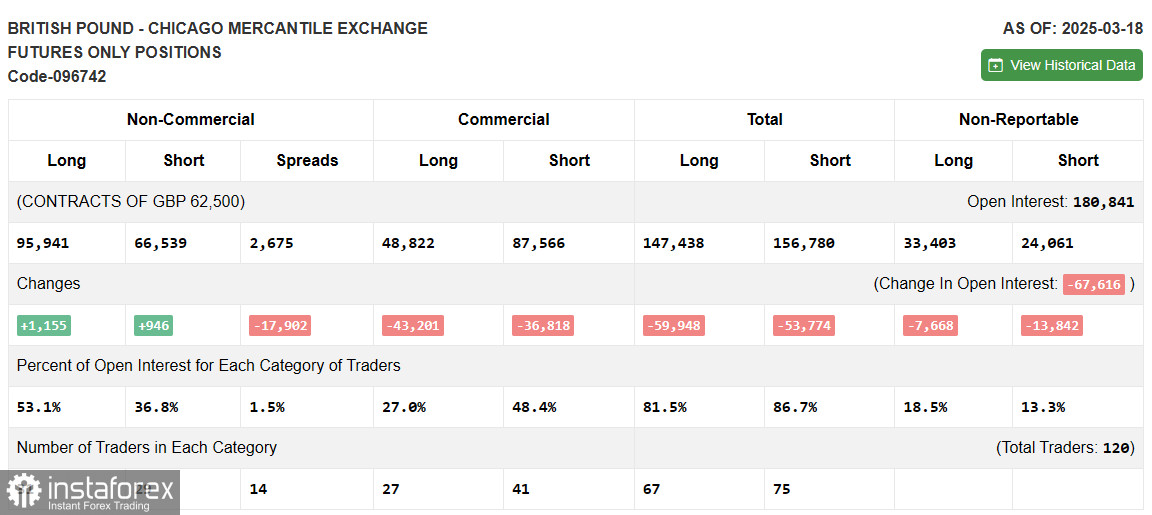
COT (Commitments of Traders) Report:
The COT report for March 18 showed a rise in both long and short positions. However, the increase in longs was much larger, making the buyers' advantage more significant—confirmed by the GBP/USD chart. The Bank of England's meeting made it clear the regulator is taking a more gradual approach to rate cuts, and the stance may become increasingly hawkish. Many are concerned by Trump's actions and tariff threats, which could trigger inflation spikes—a problem the UK is already facing. The current BoE stance favors pound buyers and will continue to support them. According to the latest COT report, long non-commercial positions rose by 1,155 to 95,941, while short non-commercial positions increased by just 946 to 66,539. As a result, the gap between long and short positions narrowed by 17,902.
Indicator Signals:
Moving Averages: Trading is occurring around the 30- and 50-day moving averages, indicating market uncertainty.
Note: The period and pricing of the moving averages are based on the author's analysis of the hourly (H1) chart and may differ from the standard daily (D1) chart definition.
Bollinger Bands: In case of a decline, the lower boundary of the indicator near 1.2922 will act as support.
Indicator Descriptions: • Moving Average – indicates the current trend by smoothing volatility and noise. Period – 50 (marked yellow on the chart); • Moving Average – indicates the current trend by smoothing volatility and noise. Period – 30 (marked green on the chart); • MACD (Moving Average Convergence/Divergence) – Fast EMA: period 12; Slow EMA: period 26; SMA: period 9; • Bollinger Bands – Period: 20; • Non-commercial traders – speculators such as individual traders, hedge funds, and large institutions using the futures market for speculative purposes and meeting certain requirements; • Long non-commercial positions – total long open positions held by non-commercial traders; • Short non-commercial positions – total short open positions held by non-commercial traders; • Total non-commercial net position – the difference between short and long non-commercial positions.