empty
14.04.2025 12:28 PM
Forecast for EUR/USD on April 14, 2025

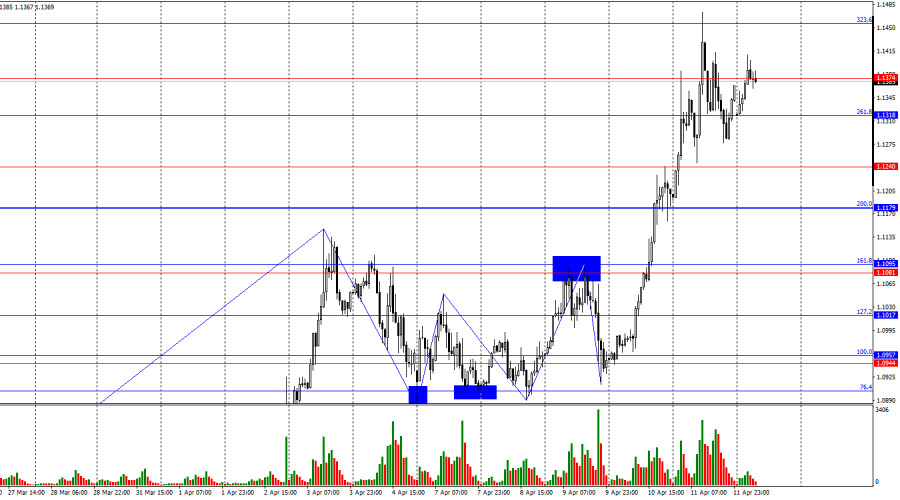
On Friday, the EUR/USD pair continued to rise but pulled back in the second half of the day. The decline (i.e., dollar strengthening) was short-lived, and by the end of Friday, the US dollar had once again posted significant losses. The current market situation suggests there is nothing stopping the dollar from continuing its decline on a daily basis. The informational backdrop is simply too strong for traders to pause midway. At the same time, over the weekend, there were no new aggressive signals from Trump, which could lead to reduced trading activity.

This image is no longer relevant

The last completed downward wave failed to break the previous low, while the new upward wave broke the prior high. This currently indicates the continuation of a bullish trend. Donald Trump continues to introduce new import tariffs, and markets remain gripped by panic and chaos. Bulls re-entered the market last week, and there are clear and logical reasons for that.

The news backdrop on Friday was much weaker than in the previous days. Trump, of course, raised tariffs on Chinese goods to an unthinkable 145%, and China responded by increasing its own tariffs to 125%. However, it seems these figures may mark the upper limit. Any further increase would appear absurd or comical and lack practical sense. Personally, I believe both sides will eventually sit down at the negotiating table. The only question is when. If Trump refrains from raising tariffs on China this week, the dollar might find some temporary relief.

Remember, Trump can only impose new tariffs against China right now, as he has granted a 90-day pause to all other countries. So, this week, the dollar might see some improvement. Still, the US–China trade war is such a significant event that it's impossible to be fully confident that the market has already priced everything in.

This image is no longer relevant

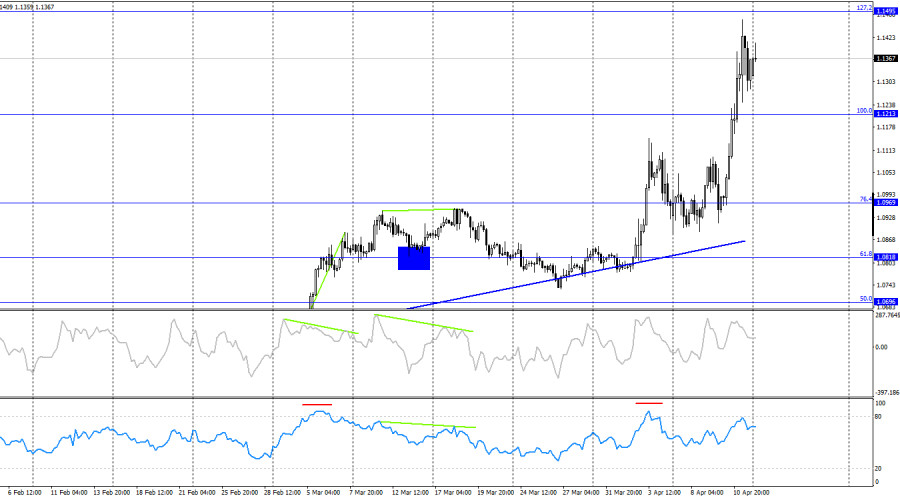
On the 4-hour chart, the pair continues to rise toward the 127.2% Fibonacci corrective level at 1.1495. The trade war, in the full sense of the word, has only just begun. Therefore, I cannot forecast a rise or fall in the pair solely based on the current data. Movements will depend entirely on the news backdrop, which may continue to flow in a steady stream this week. The bullish trend remains intact. A bounce from the 1.1495 level would suggest a potential reversal in favor of the US currency and a moderate decline.

Commitments of Traders (COT) Report:

This image is no longer relevant

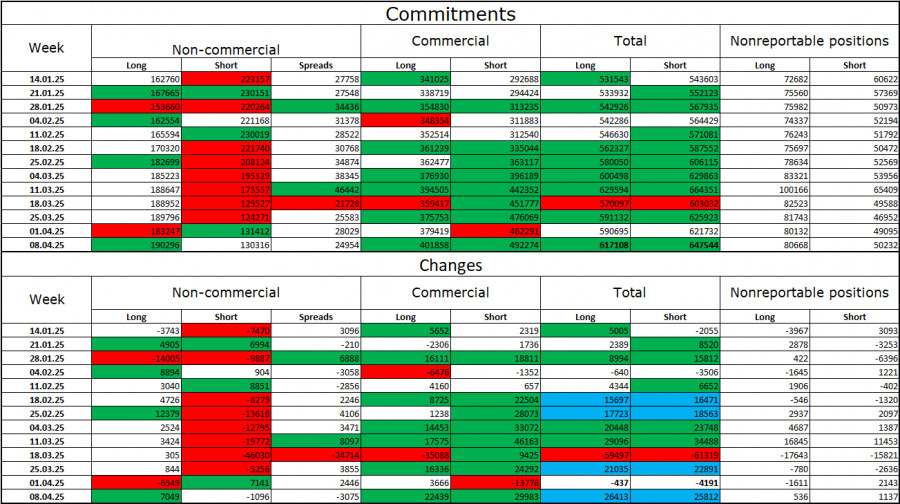
During the most recent reporting week, professional traders opened 7,049 long positions and closed 1,096 short positions. The sentiment of the Non-commercial group has recently turned bullish again – thanks to Donald Trump. Total long positions held by speculators now amount to 190,000 and total short positions are at 130,000.

For 20 weeks straight, large players were shedding euro positions, but for the past 9 weeks, they've been reducing short positions and building long ones. The divergence in monetary policy approaches between the ECB and the Fed still supports the US dollar, but Trump's policies are now a more influential factor for traders. His actions may push the Fed toward a more dovish stance and potentially trigger a recession in the US economy.

News Calendar for the US and Eurozone:

On April 14, the economic calendar contains no significant entries. Therefore, the influence of the news background on market sentiment may be minimal on Monday — unless new tariff announcements emerge over the weekend. Such headlines remain the main market driver right now.

EUR/USD Forecast and Trading Advice:

Buy or sell opportunities for the pair today should be considered only if clear signals appear around key levels on the hourly chart. However, I'd like to stress again that movements will mostly depend on the news background, not the technical setup.

Fibonacci levels are plotted from 1.0957–1.0733 on the hourly chart and from 1.1214–1.0179 on the 4-hour chart.

Samir Klishi,
Analytical expert of InstaForex
© 2007-2025
Select timeframe
5
min
15
min
30
min
1
hour
4
hours
1
day
1
week
Earn on cryptocurrency rate changes with InstaForex
Download MetaTrader 4 and open your first trade
  • Chancy Deposit
    Deposit your account with $3,000 and get $9000 more!
    In May we raffle $9000 within the Chancy Deposit campaign!
    Get a chance to win by depositing $3,000 to a trading account. Having fulfilled this condition, you become a campaign participant.
    JOIN CONTEST

Recommended Stories

Trading Signals for EUR/USD for April 30, 2025: sell below 1.1376 (21 SMA - 7/8 Murray)

Early in the American session, the EUR/USD pair is trading around 1.1378 within the downtrend channel formed on April 17 and showing signs of exhaustion of bullish strength. A technical

Dimitrios Zappas 17:37 2025-04-30 UTC+2

Forex forecast 30/04/2025: EUR/USD, AUD/USD, USD/JPY, Gold, and Bitcoin

Useful links: My other articles are available in this section InstaForex course for beginners Popular Analytics Open trading account Important: The begginers in forex trading need to be very careful

Sebastian Seliga 16:31 2025-04-30 UTC+2

Trading Signals for GOLD (XAU/USD) for April 30, 2025: buy above $3,270 (21 SMA - 6/8 Murray)

Early in the American session, gold is trading around 3,384, above key support and rebounding after reaching 3,267. Gold is expected to regain strength if it consolidates above 3,381 (6/8

Dimitrios Zappas 15:07 2025-04-30 UTC+2

Forex forecast 29/04/2025: EUR/USD, GBP/USD, Gold, Ethereum and Bitcoin

Useful links: My other articles are available in this section InstaForex course for beginners Popular Analytics Open trading account Important: The begginers in forex trading need to be very careful

Sebastian Seliga 08:41 2025-04-30 UTC+2

Technical Analysis of Intraday Price Movement of AUD/JPY Cross Currency Pairs, Wednesday April 30, 2025.

With the appearance of Divergent and Descending Broadening Wedge patterns on the 4-hour chart of the AUD/JPY cross currency pair, although its price movement is below the EMA (21) which

Arief Makmur 06:19 2025-04-30 UTC+2

Technical Analysis of Intraday Price Movement of USD/JPY Main Currency Pairs, Wednesday April 30, 2025.

On the 4-hour chart of the main currency pair USD/JPY, it can be seen that the Stochastic Oscillator indicator forms a Double Bottom pattern while the price movement of USD/JPY

Arief Makmur 06:17 2025-04-30 UTC+2

Trading Signals for GOLD (XAU/USD) for April 29-30, 2025: buy above $3,310 (21 SMA - 7/8 Murray)

Early in the American session, gold is trading around the 3,310 level, where it is located at the 21SMA and within a symmetrical triangle pattern formed on April 23. Consolidation

Dimitrios Zappas 18:10 2025-04-29 UTC+2

Trading Signals for EUR/USD for April 29-30, 2025: sell below 1.1410 (symmetrical triangle - 7/8 Murray)

Our trading plan for the coming hours is to sell below 1.1410 with targets at 1.1370 and 1.1230. The eagle indicator is giving a negative signal, so we believe

Dimitrios Zappas 17:52 2025-04-29 UTC+2

Forex forecast 28/04/2025: EUR/USD, GBP/USD, USD/JPY, USDX, Gold and Bitcoin

Useful links: My other articles are available in this section InstaForex course for beginners Popular Analytics Open trading account Important: The begginers in forex trading need to be very careful

Sebastian Seliga 18:34 2025-04-28 UTC+2

Trading Signals for EUR/USD for April 28-30, 2025: sell below 1.1370 (21 SMA - 7/8 Murray)

On the other hand, if bearish pressure prevails and the euro consolidates below 1.1370, it could be seen as a sell signal with targets at the 6/8 Murray located

Dimitrios Zappas 16:29 2025-04-28 UTC+2
Can't speak right now?
Ask your question in the chat.
Widget callback