Актуальные паттерны
Паттерны – это графические модели, которые "рисует" цена на графике. Один из постулатов технического анализа говорит нам о том, что история (движение цены) всегда повторяется. Это значит, что в похожих ситуациях движение цены, зачастую, будет похожим, что позволяет с высокой долей вероятности спрогнозировать дальнейшее развитие ситуации.
Актуальные паттерны
- Все
- Вымпел
- Голова и плечи
- Двойная вершина
- Прямоугольник
- Треугольник
- Тройная вершина
- Флаг
- Все
- #AAPL
- #AMZN
- #Bitcoin
- #EBAY
- #FB
- #GOOG
- #INTC
- #KO
- #MA
- #MCD
- #MSFT
- #NTDOY
- #PEP
- #TSLA
- #TWTR
- AUDCAD
- AUDCHF
- AUDJPY
- AUDUSD
- EURCAD
- EURCHF
- EURGBP
- EURJPY
- EURNZD
- EURRUB
- EURUSD
- GBPAUD
- GBPCHF
- GBPJPY
- GBPUSD
- GOLD
- NZDCAD
- NZDCHF
- NZDJPY
- NZDUSD
- SILVER
- USDCAD
- USDCHF
- USDJPY
- USDRUB
- Все
- M5
- M15
- M30
- H1
- D1
- Все
- Покупка
- Продажа
- Все
- 1
- 2
- 3
- 4
- 5
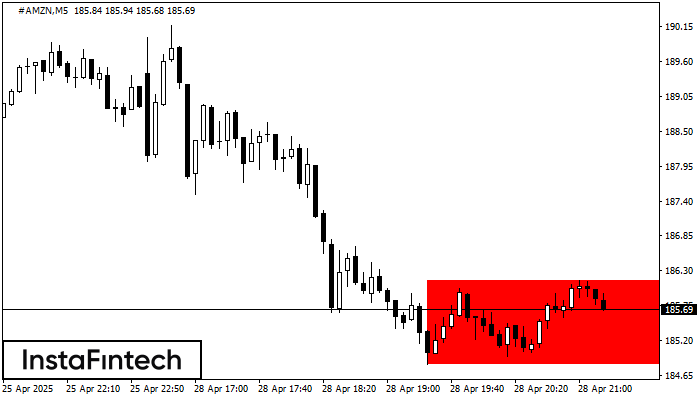
According to the chart of M5, #AMZN formed the Bearish Rectangle. The pattern indicates a trend continuation. The upper border is 186.15, the lower border is 184.83. The signal means
The M5 and M15 time frames may have more false entry points.
Open chart in a new window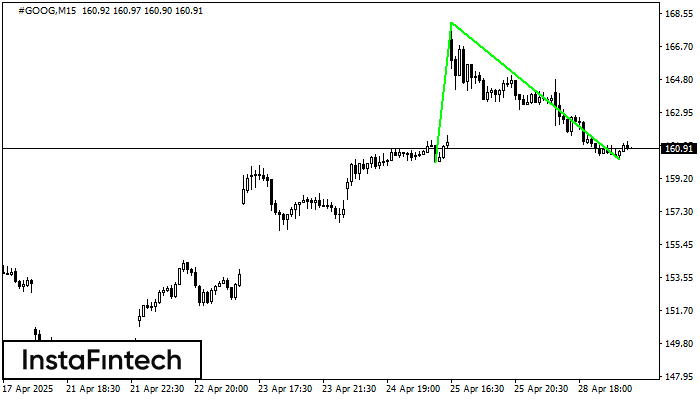
The Double Bottom pattern has been formed on #GOOG M15. Characteristics: the support level 160.09; the resistance level 168.07; the width of the pattern 798 points. If the resistance level
The M5 and M15 time frames may have more false entry points.
Open chart in a new window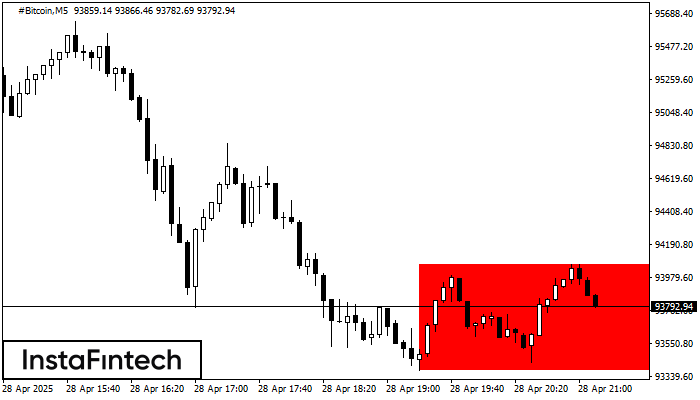
According to the chart of M5, #Bitcoin formed the Bearish Rectangle which is a pattern of a trend continuation. The pattern is contained within the following borders: lower border 93376.97
The M5 and M15 time frames may have more false entry points.
Open chart in a new window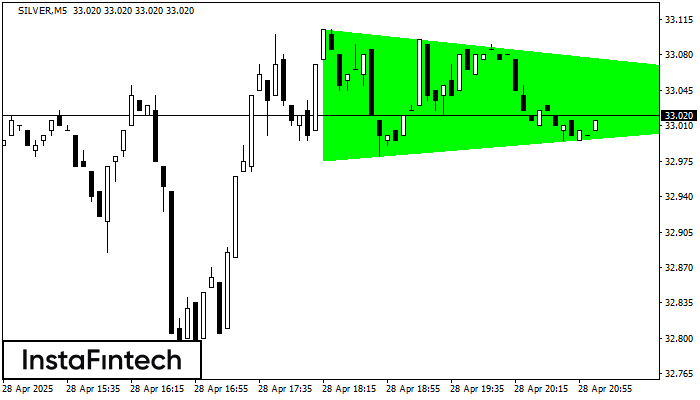
According to the chart of M5, SILVER formed the Bullish Symmetrical Triangle pattern, which signals the trend will continue. Description. The upper border of the pattern touches the coordinates 33.10/33.03
The M5 and M15 time frames may have more false entry points.
Open chart in a new window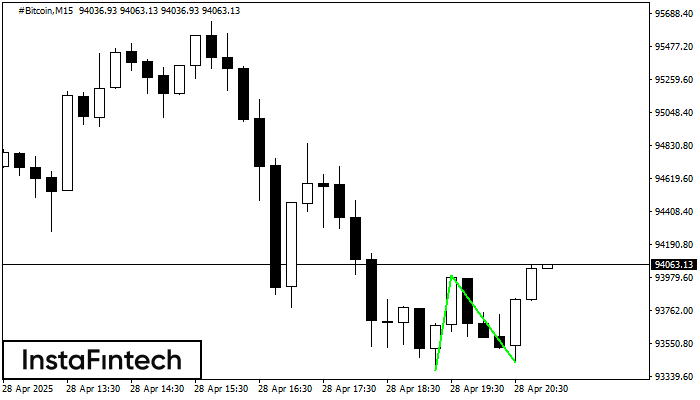
The Double Bottom pattern has been formed on #Bitcoin M15. This formation signals a reversal of the trend from downwards to upwards. The signal is that a buy trade should
The M5 and M15 time frames may have more false entry points.
Open chart in a new window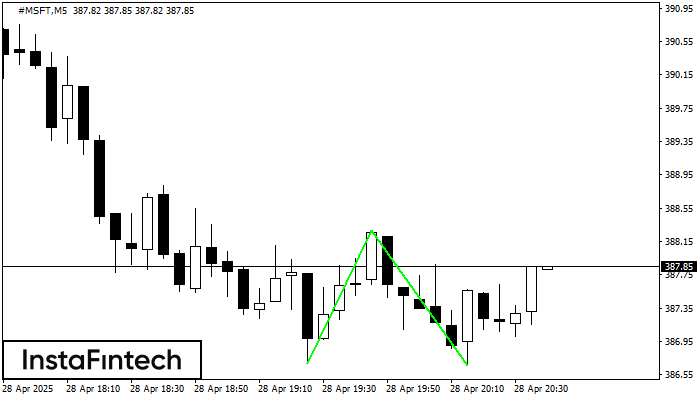
The Double Bottom pattern has been formed on #MSFT M5; the upper boundary is 388.28; the lower boundary is 386.66. The width of the pattern is 159 points. In case
The M5 and M15 time frames may have more false entry points.
Open chart in a new window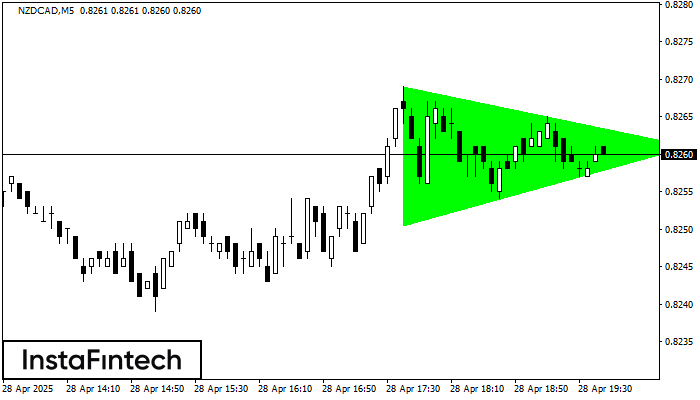
According to the chart of M5, NZDCAD formed the Bullish Symmetrical Triangle pattern. The lower border of the pattern touches the coordinates 0.8250/0.8261 whereas the upper border goes across 0.8269/0.8261
The M5 and M15 time frames may have more false entry points.
Open chart in a new window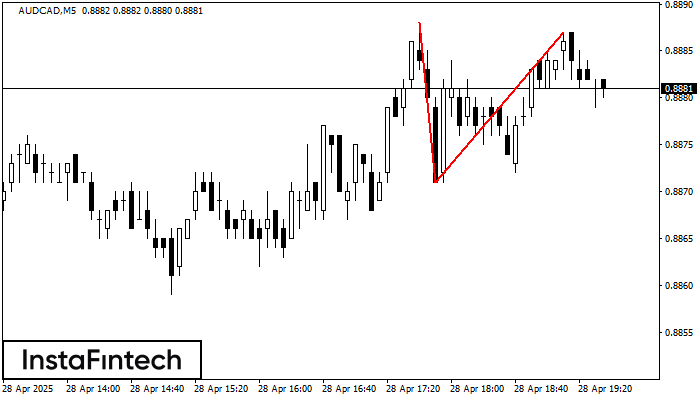
The Double Top reversal pattern has been formed on AUDCAD M5. Characteristics: the upper boundary 0.8888; the lower boundary 0.8871; the width of the pattern is 16 points. Sell trades
The M5 and M15 time frames may have more false entry points.
Open chart in a new window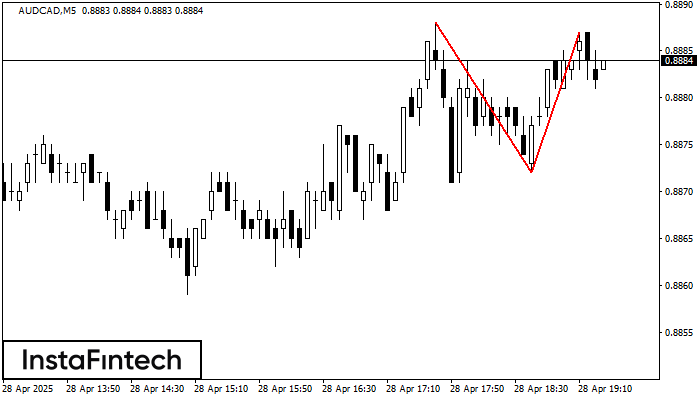
The Double Top pattern has been formed on AUDCAD M5. It signals that the trend has been changed from upwards to downwards. Probably, if the base of the pattern 0.8872
The M5 and M15 time frames may have more false entry points.
Open chart in a new window