signal strength 1 of 5
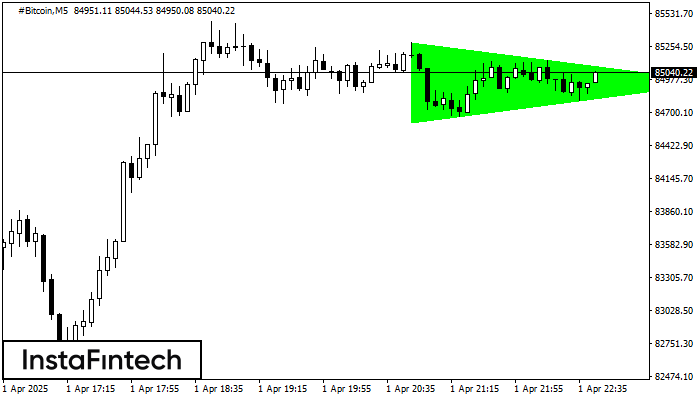
According to the chart of M5, #Bitcoin formed the Bullish Symmetrical Triangle pattern, which signals the trend will continue. Description. The upper border of the pattern touches the coordinates 85289.02/84955.46 whereas the lower border goes across 84612.93/84955.46. The pattern width is measured on the chart at 67609 pips. If the Bullish Symmetrical Triangle pattern is in progress during the upward trend, this indicates the current trend will go on. In case 84955.46 is broken, the price could continue its move toward 84955.61.
The M5 and M15 time frames may have more false entry points.
Juga lihat
- All
- Double Top
- Flag
- Head and Shoulders
- Pennant
- Rectangle
- Triangle
- Triple top
- All
- #AAPL
- #AMZN
- #Bitcoin
- #EBAY
- #FB
- #GOOG
- #INTC
- #KO
- #MA
- #MCD
- #MSFT
- #NTDOY
- #PEP
- #TSLA
- #TWTR
- AUDCAD
- AUDCHF
- AUDJPY
- AUDUSD
- EURCAD
- EURCHF
- EURGBP
- EURJPY
- EURNZD
- EURRUB
- EURUSD
- GBPAUD
- GBPCHF
- GBPJPY
- GBPUSD
- GOLD
- NZDCAD
- NZDCHF
- NZDJPY
- NZDUSD
- SILVER
- USDCAD
- USDCHF
- USDJPY
- USDRUB
- All
- M5
- M15
- M30
- H1
- D1
- All
- Buy
- Sale
- All
- 1
- 2
- 3
- 4
- 5

El patrón Bandera bajista ha sido formado en el gráfico NZDCAD H1 que señala que la tendencia bajista continuará. Si el precio rompe por debajo del mínimo a 0.8194, entonces
Open chart in a new window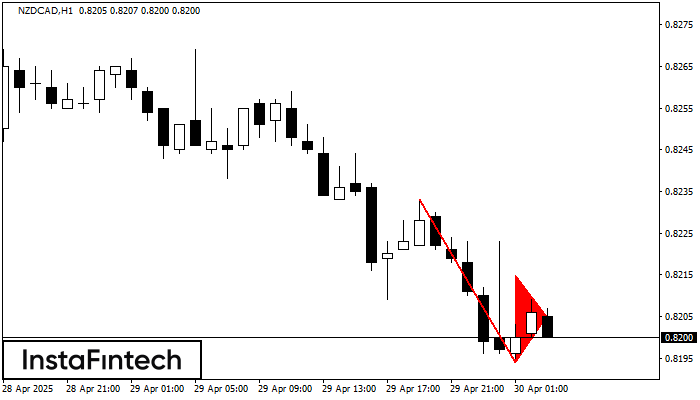
El patrón Banderín bajista se ha formado en el gráfico NZDCAD H1. El patrón señala la continuación de la tendencia bajista en caso de que se rompa el mínimo
Open chart in a new window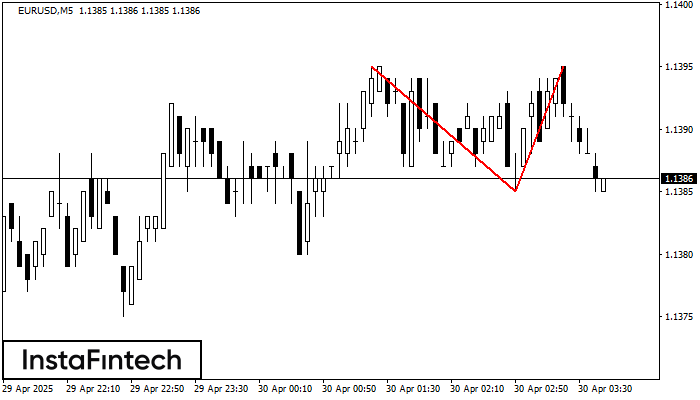
El patrón de reversión Doble Techo ha sido formado en EURUSD M5. Características: el límite superior 1.1395; el límite inferior 1.1385; el ancho del patrón es 10 puntos. Es mejor
Los marcos de tiempo M5 y M15 pueden tener más puntos de entrada falsos.
Open chart in a new window