signal strength 3 of 5
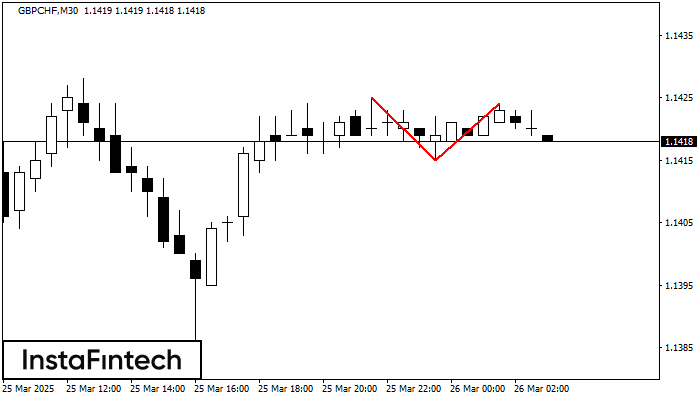
The Double Top reversal pattern has been formed on GBPCHF M30. Characteristics: the upper boundary 1.1425; the lower boundary 1.1415; the width of the pattern is 9 points. Sell trades are better to be opened below the lower boundary 1.1415 with a possible movements towards the 1.1385 level.
See Also
- All
- Double Top
- Flag
- Head and Shoulders
- Pennant
- Rectangle
- Triangle
- Triple top
- All
- #AAPL
- #AMZN
- #Bitcoin
- #EBAY
- #FB
- #GOOG
- #INTC
- #KO
- #MA
- #MCD
- #MSFT
- #NTDOY
- #PEP
- #TSLA
- #TWTR
- AUDCAD
- AUDCHF
- AUDJPY
- AUDUSD
- EURCAD
- EURCHF
- EURGBP
- EURJPY
- EURNZD
- EURRUB
- EURUSD
- GBPAUD
- GBPCHF
- GBPJPY
- GBPUSD
- GOLD
- NZDCAD
- NZDCHF
- NZDJPY
- NZDUSD
- SILVER
- USDCAD
- USDCHF
- USDJPY
- USDRUB
- All
- M5
- M15
- M30
- H1
- D1
- All
- Buy
- Sale
- All
- 1
- 2
- 3
- 4
- 5
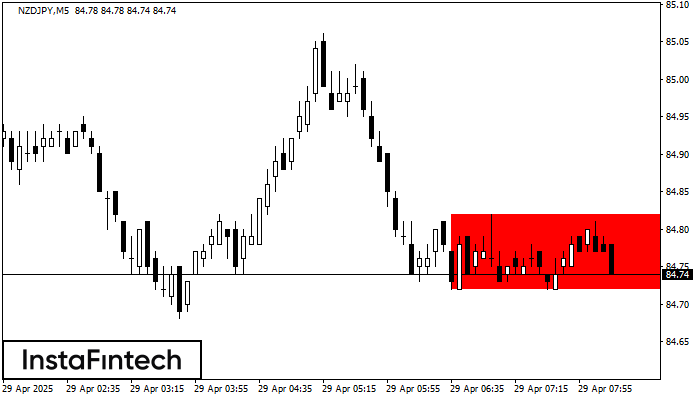
According to the chart of M5, NZDJPY formed the Bearish Rectangle. The pattern indicates a trend continuation. The upper border is 84.82, the lower border is 84.72. The signal means
The M5 and M15 time frames may have more false entry points.
Open chart in a new window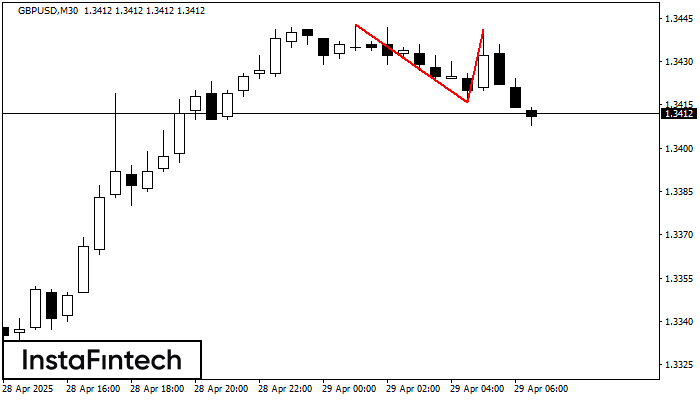
On the chart of GBPUSD M30 the Double Top reversal pattern has been formed. Characteristics: the upper boundary 1.3441; the lower boundary 1.3416; the width of the pattern 25 points
Open chart in a new window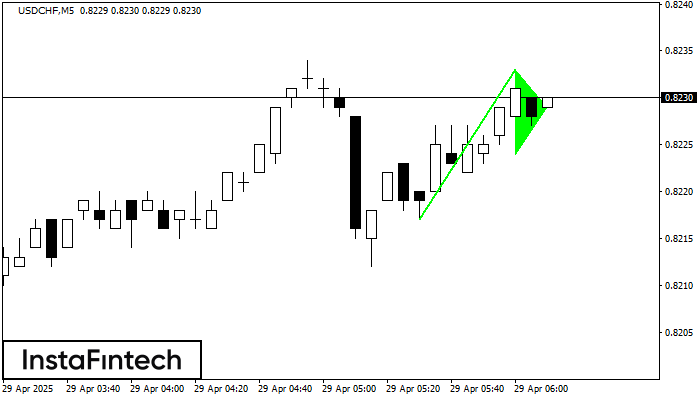
The Bullish pennant pattern is formed on the USDCHF M5 chart. It is a type of the continuation pattern. Supposedly, in case the price is fixed above the pennant’s high
The M5 and M15 time frames may have more false entry points.
Open chart in a new window