empty
 
 
04.02.2025 12:40 PM
GBP/USD. February 4th. Will the Market Notice the Bank of England Meeting?

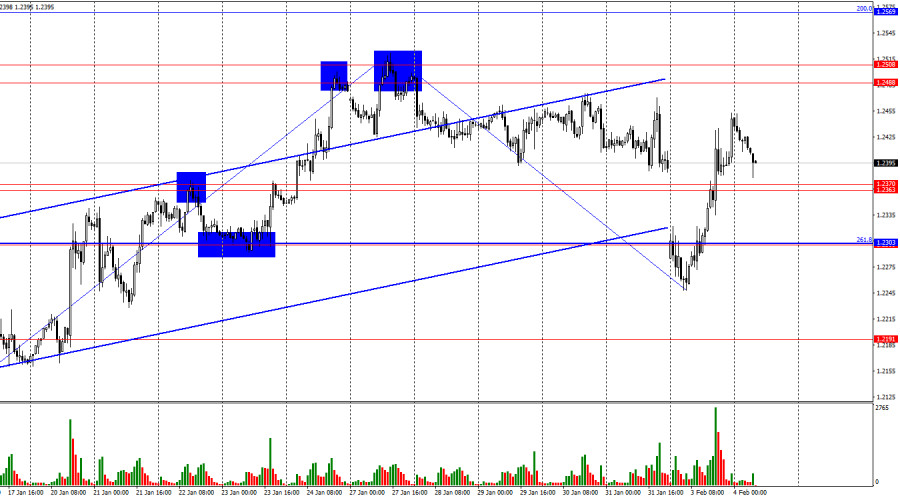
On the hourly chart, the GBP/USD pair reversed on Monday and showed significant growth, closing above Friday's level. The pair's consolidation above the resistance zone of 1.2363–1.2370 suggests a potential continuation of the uptrend towards the next resistance at 1.2488–1.2508. Conversely, a consolidation below the 1.2363–1.2370 zone could signal a resumption of the decline and the start of a bearish trend.

This image is no longer relevant

The wave structure is quite clear. The last completed upward wave broke above the peak of the previous wave. The last completed downward wave did not breach the previous low. Thus, we can assume that a bullish trend is still forming. However, recent waves are small and can be interpreted in different ways. I'm not confident that we're witnessing a bullish trend that will persist for a few more weeks.

Monday provided strong fundamental data for both the pound and the dollar: The UK Manufacturing PMI rose from 47.0 to 48.3. The U.S. ISM Manufacturing PMI climbed from 49.2 to 50.9.

However, Monday's movements weren't driven by these indices. Initially, traders reacted fervently to Trump's decision to impose import tariffs, then recovered after the market drop, and later adjusted after Trump announced a 30-day suspension of tariffs for Mexico and Canada. This month will likely be spent in negotiations, after which it will become clear whether the U.S.'s closest neighbors will face tariffs.

Amid these developments, many have overlooked the upcoming Bank of England meeting this week, where a decision to ease monetary policy is expected. This event could bring bears back into the market, after they largely retreated on Monday. However, bulls are also at risk: important U.S. reports on labor markets and unemployment could trigger a new dollar decline.

This image is no longer relevant

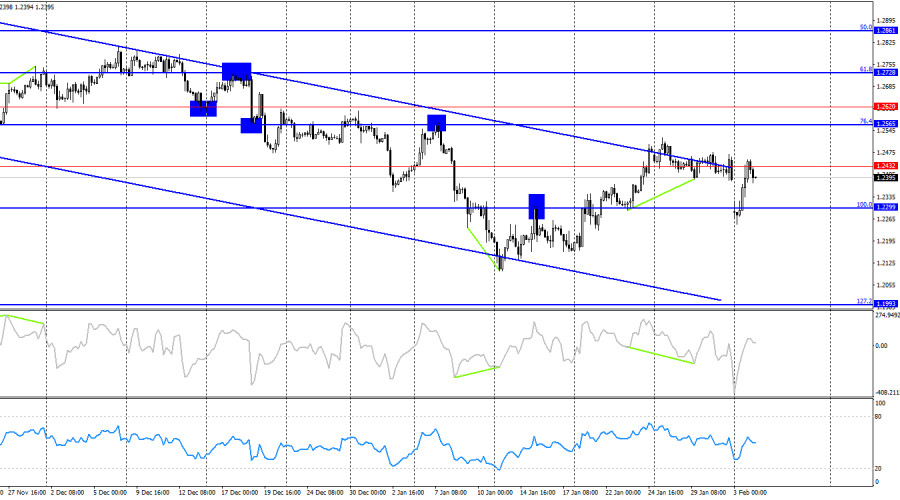
On the 4-hour chart, the pair has returned to the 1.2432 level and the upper line of the downward trend channel. A rebound from these lines would suggest a reversal in favor of the U.S. dollar and a new decline below the 100.0% retracement level at 1.2299. A clear consolidation above these lines would significantly increase the probability of continued growth towards the next Fibonacci level at 1.2565, effectively canceling the bearish trend. No emerging divergences are observed today.

Commitments of Traders (COT) Report:

This image is no longer relevant

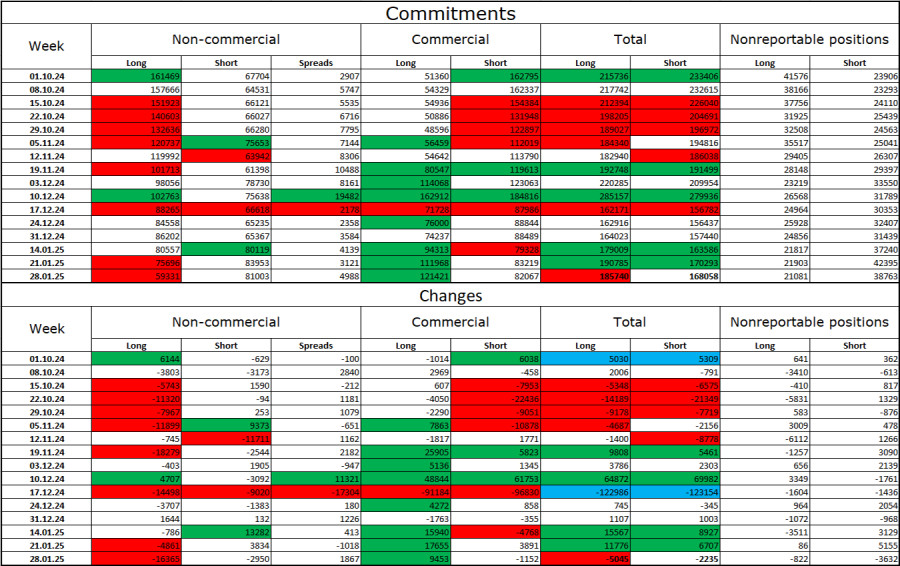
The sentiment among Non-commercial traders became even more bearish in the last reporting week. The number of long positions held by speculators decreased by 16,365, while short positions dropped by 2,950. Bulls have lost all market advantage, a process that has been unfolding over several months. The gap between long and short positions now favors the bears: 59,000 vs. 81,000.

In my view, the pound remains poised for further decline, with COT reports signaling stronger bearish positions almost every week. Over the past three months, long positions have decreased from 161,000 to 59,000. Short positions have risen from 67,000 to 81,000.

I believe professional traders will continue reducing long positions or increasing shorts, as all potential factors supporting the pound have already been priced in. While technical analysis currently signals growth, corrections are also expected.

News Calendar for the U.S. and the U.K.:

  • U.S. – JOLTS Job Openings (15:00 UTC).

On Tuesday, the economic calendar contains only one key event. The impact of the information background on trader sentiment today may be weak. However, Trump's actions remain an influential factor.

GBP/USD Forecast and Trading Tips:

Selling the pair will be possible if the price consolidates below the upward trend channel on the hourly chart. However, it's best to wait for market stabilization. A rebound from the 1.2363–1.2370 zone would allow for buying the pair, targeting 1.2488–1.2508 on the hourly chart. A close below the 1.2363–1.2370 zone would favor selling, with a target of 1.2191.

Fibonacci Levels:

  • Hourly chart: Levels are drawn from 1.3000 to 1.3432.
  • 4-hour chart: Levels are drawn from 1.2299 to 1.3432.
Samir Klishi,
انسٹافاریکس کا تجزیاتی ماہر
© 2007-2025
انسٹافاریکس کے ساتھ کرپٹو کرنسی کی معاملاتی تبدیلیوں سے کمائیں۔
میٹا ٹریڈر 4 ڈاؤن لوڈ کریں اور اپنی پہلی ٹریڈ کھولیں۔
  • Grand Choice
    Contest by
    InstaForex
    InstaForex always strives to help you
    fulfill your biggest dreams.
    مقابلہ میں شامل ہوں
  • چانسی ڈیپازٹ
    اپنے اکاؤنٹ میں 3000 ڈالر جمع کروائیں اور حاصل کریں$1000 مزید!
    ہم فروری قرعہ اندازی کرتے ہیں $1000چانسی ڈیپازٹ نامی مقابلہ کے تحت
    اپنے اکاؤنٹ میں 3000 ڈالر جمع کروانے پر موقع حاصل کریں - اس شرط پر پورا اُترتے ہوئے اس مقابلہ میں شرکت کریں
    مقابلہ میں شامل ہوں
  • ٹریڈ وائز، ون ڈیوائس
    کم از کم 500 ڈالر کے ساتھ اپنے اکاؤنٹ کو ٹاپ اپ کریں، مقابلے کے لیے سائن اپ کریں، اور موبائل ڈیوائسز جیتنے کا موقع حاصل کریں۔
    مقابلہ میں شامل ہوں
  • 100 فیصد بونس
    اپنے ڈپازٹ پر 100 فیصد بونس حاصل کرنے کا آپ کا منفرد موقع
    بونس حاصل کریں
  • 55 فیصد بونس
    اپنے ہر ڈپازٹ پر 55 فیصد بونس کے لیے درخواست دیں
    بونس حاصل کریں
  • 30 فیصد بونس
    ہر بار جب آپ اپنا اکاؤنٹ ٹاپ اپ کریں تو 30 فیصد بونس حاصل کریں
    بونس حاصل کریں

تجویز کردہ مضامین

ابھی فوری بات نہیں کرسکتے ؟
اپنا سوال پوچھیں بذریعہ چیٹ.
Widget callback