empty
31.10.2023 06:32 AM
EUR/USD and GBP/USD: Technical analysis for October 31

EUR/USD

This image is no longer relevant

Higher Timeframes

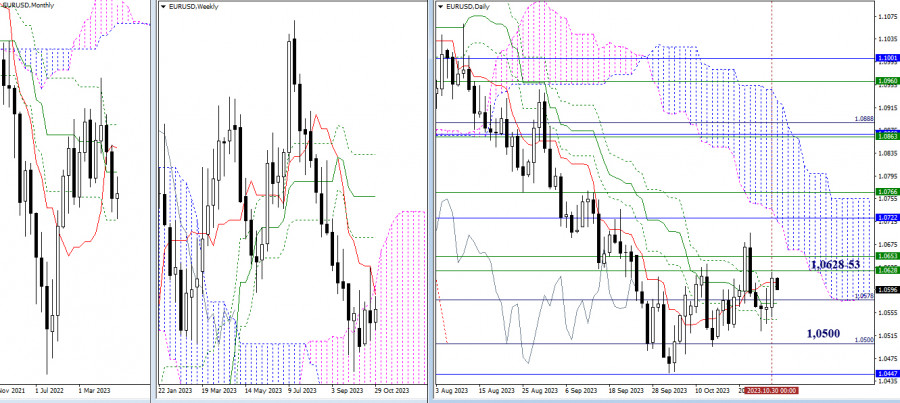
At the end of yesterday, judging by the mood and the shape of the daily candle, it can be said that the advantage during the day belonged to the bullish players. However, one day did not fundamentally change the situation. The main conclusions and expectations remain the same. For the bulls, it is now important to overcome the weekly resistances at 1.0628 – 1.0653 (weekly short-term trend + upper boundary of the weekly cloud). Next, attention will be on updating the high (1.0695) and testing the area of 1.0716-22 (lower boundary of the daily cloud + monthly medium-term trend). The current support and influence on the situation at the moment are provided by the levels of the daily Ichimoku cross (1.0609 – 1.0601 – 1.0572 – 1.0543). The subsequent bearish targets today retain their significance and are located at 1.0500 (daily target level) and 1.0447 (final level of the monthly Ichimoku cross).

This image is no longer relevant

H4 – H1

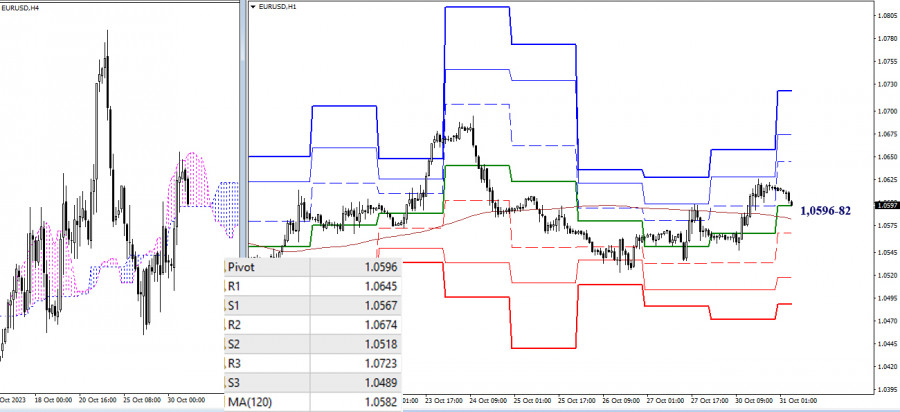
On the lower timeframes, bulls rose above the key levels, turning them into supports. However, they have not been able to reverse the movement yet. In case of further ascent, the next bullish targets within the day can be noted at 1.0645 – 1.0674 – 1.0723 (resistances of classic pivot points). A change in sentiment can happen very quickly now; it is enough for the bears to drop below the key levels located today at 1.0596 – 1.0582 (central pivot point + weekly long-term trend). The next intraday bearish targets are at 1.0567 – 1.0518 – 1.0489 (supports of classic pivot points).

***

GBP/USD

This image is no longer relevant

Higher Timeframes

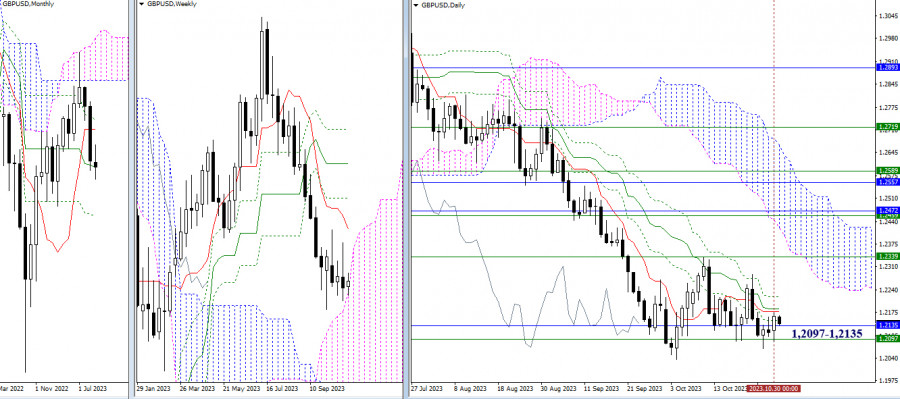
The pound continues to be influenced by the force of attraction of two significant levels in the area of 1.2097 – 1.2135 (upper boundary of the weekly cloud + monthly medium-term trend). Bearish players need an exit from the current zone of attraction and a reliable reversal of the downward trend through the update of the low (1.2036). For the bulls, it is important to eliminate the daily cross (1.2151 – 1.2178 – 1.2186 – 1.2221) and consolidate above the weekly short-term trend (1.2339).

This image is no longer relevant

H4 – H1

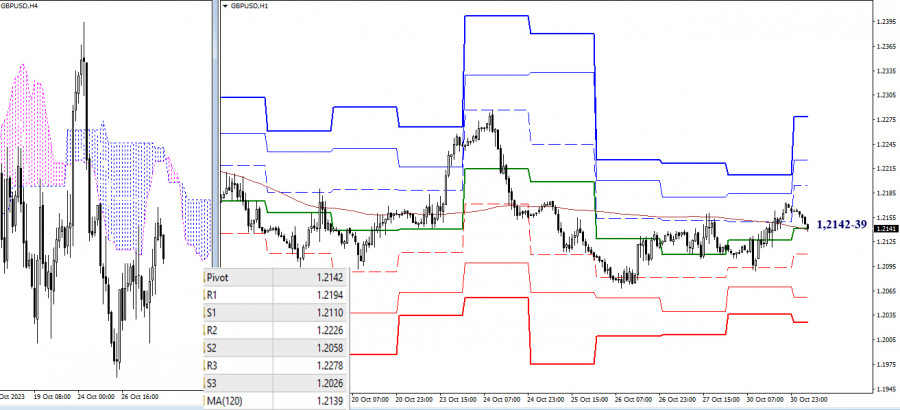
On the lower timeframes, the key levels today have come together in the area of 1.2139 – 1.2142 (weekly long-term trend + central pivot point of the day). Interacting with the key levels, the market seems to be in a point of balance and uncertainty. Trading above the key levels gives the advantage to strengthening bullish sentiments. The resistances of classic pivot points (1.2194 – 1.2296 – 1.2278) can serve as targets for the development of an intraday rise. Trading below the key levels may create conditions for bearish activity and a decline. Intraday bearish targets are at the support levels of classic pivot points (1.2110 – 1.2058 – 1.2026).

***

The technical analysis of the situation uses:

Higher timeframes - Ichimoku Kinko Hyo (9.26.52) + Fibo Kijun levels

Lower timeframes - H1 - Pivot Points (classic) + Moving Average 120 (weekly long-term trend)

Evangelos Poulakis,
Especialista em análise na InstaForex
© 2007-2025
Selecionar intervalo de tempo
5
min
15
min
30
min
1
hora
4
horas
1
dia
1
s.
Ganhe com as variações das taxas das criptomoedas com a InstaForex.
Baixe o MetaTrader 4 e abra a sua primeira operação.
  • Grand Choice
    Contest by
    InstaForex
    InstaForex always strives to help you
    fulfill your biggest dreams.
    PARTICIPE DO CONCURSO

Recommended Stories

GBP/USD. Análise e previsão

Hoje, o par GBP/USD recua após o impulso altista observado ontem, com o movimento corretivo sendo sustentado pela modesta força do dólar norte-americano. Do ponto de vista técnico

Irina Yanina 20:51 2025-05-07 UTC+2

Sinais de negociação para o OURO (XAU/USD) para 7 a 9 de maio de 2025: comprar acima de $3.360 (SMA 21 - 8/8 de Murray)

No início da sessão americana, o ouro está sendo negociado em torno de US$ 3.382, recuperando-se após atingir uma mínima de US$ 3.359 na abertura do mercado. Uma forte recuperação

Dimitrios Zappas 20:46 2025-05-07 UTC+2

Análise técnica do movimento intradiário de preços do gás natural, quarta-feira, 07 de maio de 2025

No gráfico de 4 horas, o Gás Natural (NG) apresenta um padrão de baixa 123, seguido por um Gancho de Ross (RH) de continuação da tendência de queda. Além disso

Arief Makmur 16:51 2025-05-07 UTC+2

Análise técnica do movimento intradiário de preços do AUD/JPY, quarta-feira, 07 de maio de 2025

Ao analisarmos o gráfico de 4 horas do par cruzado AUD/JPY, observamos a formação de um padrão de Cunha Descendente Ampliada, o que sinaliza um possível fortalecimento

Arief Makmur 16:33 2025-05-07 UTC+2

EUR/USD – 7 de maio: Os touros estão revertendo a tendência

Na terça-feira, o par EUR/USD reverteu a favor do euro e subiu para a zona de resistência de 1,1374-1,1383. Uma recuperação dessa zona desencadeou um declínio em favor do dólar

Samir Klishi 15:46 2025-05-07 UTC+2

GBP/USD – 7 de maio: Incerteza global e o FOMC

No gráfico de uma hora, o par GBP/USD inverteu sua direção na terça-feira a favor da libra esterlina, fechando acima da zona de resistência entre 1,3344–1,3357. Assim, um recuo

Samir Klishi 15:21 2025-05-07 UTC+2

Sinais de negociação para o EUR/USD para 6-8 de maio de 2025: venda abaixo de 1,1370 (EMA 200 - 6/8 de Murray)

Tecnicamente, o euro está esgotado. Assim, a perspectiva de baixa pode permanecer válida enquanto o ER/USD se estabelecer abaixo de 1,1370. Ele poderia, então, atingir a EMA 200 localizada

Dimitrios Zappas 22:28 2025-05-06 UTC+2

Sinais de negociação para o OURO (XAU/USD) para 6-8 de maio de 2025: venda abaixo de $3.405 (SMA 2 - 8/8 de Murray)

No início da sessão americana, o ouro está sendo negociado próximo de US$ 3.381, após recuar de uma máxima em torno de US$ 3.397. Como ativo de porto seguro

Dimitrios Zappas 22:24 2025-05-06 UTC+2

EUR/USD. 6 de maio. Os ursos fizeram tudo o que podiam

Na segunda-feira, o par EUR/USD fez uma nova reversão em favor do dólar americano, mas desta vez a queda foi ainda mais fraca. Durante a maior parte da semana passada

Samir Klishi 18:39 2025-05-06 UTC+2

Análise técnica do movimento intradiário de preços do #CL, terça-feira, 06 de maio de 2025

Com a formação de um padrão de preço caracterizado por mínimos mais baixos e máximos mais altos, aliado à inclinação descendente da WMA (30, deslocamento 2) e ao fato

Arief Makmur 15:52 2025-05-06 UTC+2
Não pode falar agora?
Faça sua pergunta no chat.
Widget callback
 

Dear visitor,

Your IP address shows that you are currently located in the USA. If you are a resident of the United States, you are prohibited from using the services of InstaFintech Group including online trading, online transfers, deposit/withdrawal of funds, etc.

If you think you are seeing this message by mistake and your location is not the US, kindly proceed to the website. Otherwise, you must leave the website in order to comply with government restrictions.

Why does your IP address show your location as the USA?

  • - you are using a VPN provided by a hosting company based in the United States;
  • - your IP does not have proper WHOIS records;
  • - an error occurred in the WHOIS geolocation database.

Please confirm whether you are a US resident or not by clicking the relevant button below. If you choose the wrong option, being a US resident, you will not be able to open an account with InstaForex anyway.

We are sorry for any inconvenience caused by this message.