empty
24.03.2025 12:13 PM
Weekly Forecast Based on Simplified Wave Analysis: EUR/USD, USD/JPY, GBP/JPY, USD/CAD, #Bitcoin, #Ripple – March 24th

EUR/USD

Analysis:

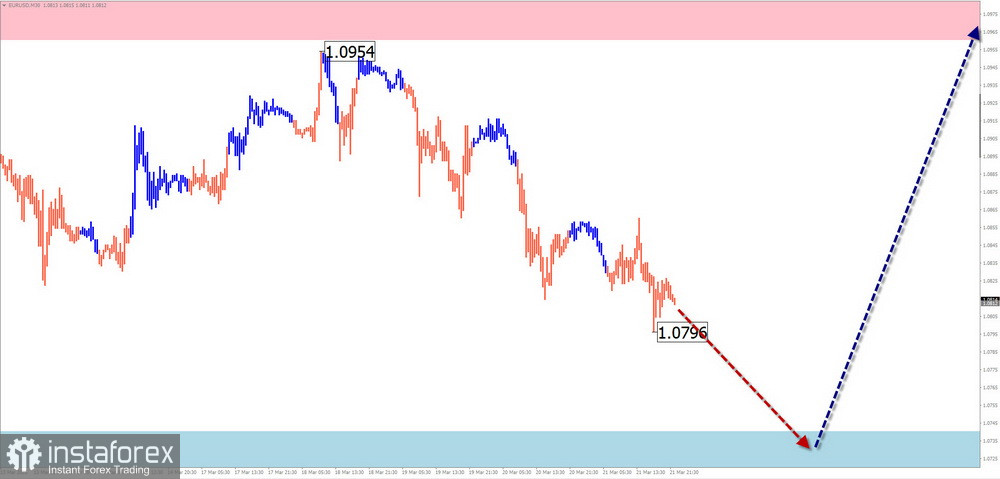
The euro's primary pair continues the upward trend that began in early February. Quotes remain within a broad potential reversal zone. Over the past three weeks, the price has been forming a flat corrective pattern. Support is located along the lower edge of the reversal zone.

Forecast:

Expect the general sideways tone to persist over the week, with a higher probability of a downward move in the first days, followed by a potential shift and resumption of price growth toward calculated resistance.

This image is no longer relevant

Potential Reversal Zones Resistance: 1.0960 / 1.1010 Support: 1.0740 / 1.0690

Recommendations:

  • Selling: Can be applied with reduced volume size within specific sessions.
  • Buying: Risky and potentially loss-making until reversal signals appear near the support zone.

USD/JPY

Analysis:

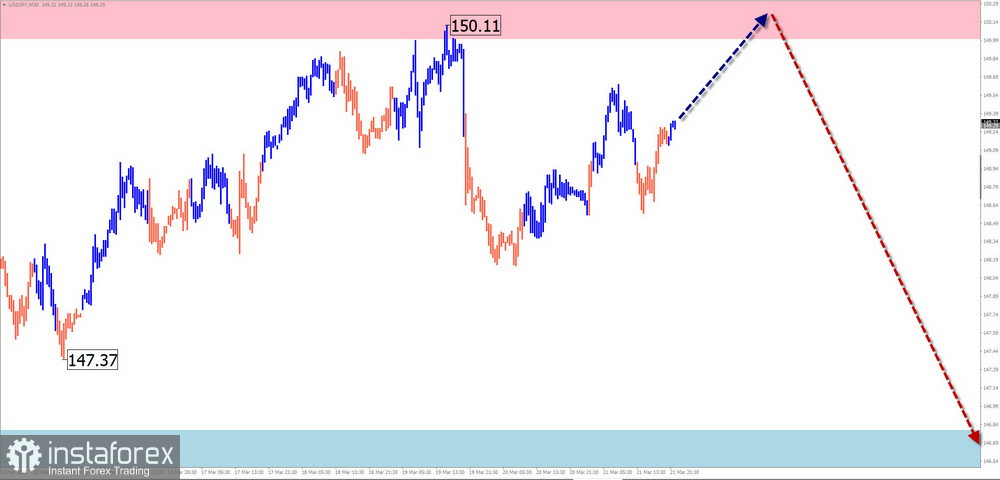
The short-term trend aligns with the global bullish trend. Since August last year, a bullish wave pattern has defined the direction. A corrective segment began in December and remains incomplete. Over the last three weeks, price has been moving sideways.

Forecast:

Expect a rise toward the resistance zone within 1–2 days. A reversal may form afterward. A trend shift is likely amid increased volatility closer to the weekend. A downward movement is expected no further than the support zone.

This image is no longer relevant

Potential Reversal Zones Resistance: 150.00 / 150.50 Support: 146.80 / 146.30

Recommendations:

  • Buying: Possible intraday with small volume size, targeting no higher than resistance.
  • Selling: Consider small-volume trades only after confirmed reversal signals appear.

GBP/JPY

Analysis:

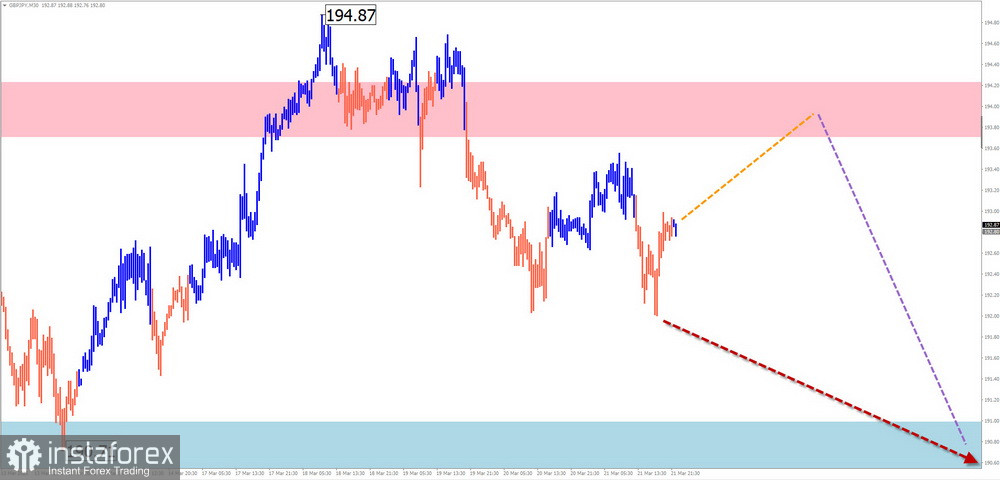
Since December, GBP/JPY has followed a short-term bearish wave pattern. For the past two months, it has been forming wave (B), the middle section of a zigzag structure, which appears close to completion. The pair is now at the lower edge of a strong reversal zone.

Forecast:

A sideways move is expected at the start of the week, with a potential rise toward resistance. Increased volatility, reversal, and a return to the downward trend are more likely toward the weekend. Support defines the lower weekly range.

This image is no longer relevant

Potential Reversal Zones Resistance: 193.70 / 194.20 Support: 191.00 / 190.50

Recommendations:

  • Buying: Limited potential; close positions at the first sign of a reversal.
  • Selling: Use confirmed reversal signals from your trading system to enter positions.

USD/CAD

Analysis:

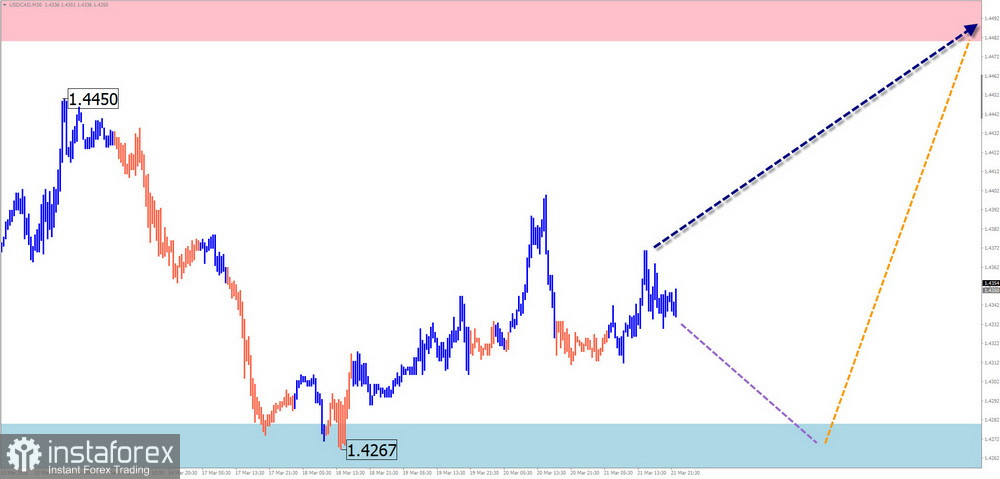
The unfinished wave pattern remains bearish since February. The current segment represents corrective wave (B), still in progress. The price is trapped within a sideways corridor between reversal zones on different timeframes.

Forecast:

After a likely consolidation, a renewed decline toward the support zone remains possible. Toward the end of the week, expect bullish sentiment to resume, possibly reaching calculated resistance.

This image is no longer relevant

Potential Reversal Zones Resistance: 1.4480 / 1.4530 Support: 1.4280 / 1.4230

Recommendations:

  • Buying: Premature without confirmed reversal signals from your trading system near support.
  • Selling: High risk; reduce volume size and exit at first signs of reversal.

#Bitcoin

Analysis:

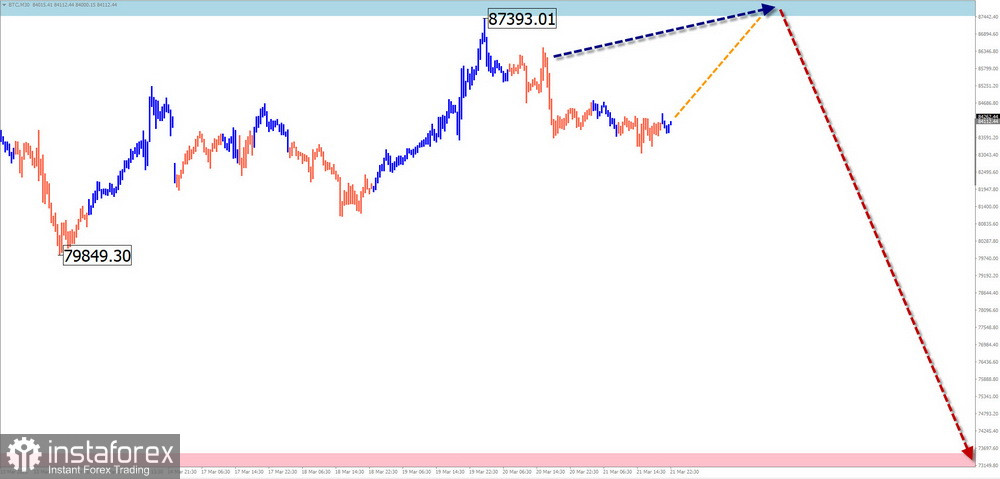
Bitcoin continues to move downward within an ongoing bearish wave structure that began in July last year. The final segment (C) is currently forming. Price has broken through a strong support zone, which has now turned into resistance.

Forecast:

Expect continued decline throughout the week from the resistance zone toward the calculated support. Temporary pressure on the upper boundary of resistance is possible in the near term.

This image is no longer relevant

Potential Reversal Zones Resistance: 87,500 / 88,500 Support: 73,500 / 72,500

Recommendations:

  • Buying: Not recommended; potential is lacking and may lead to losses.
  • Selling: Valid only after confirmed reversal signals near the resistance zone from your trading strategy.

#Ripple

Analysis:

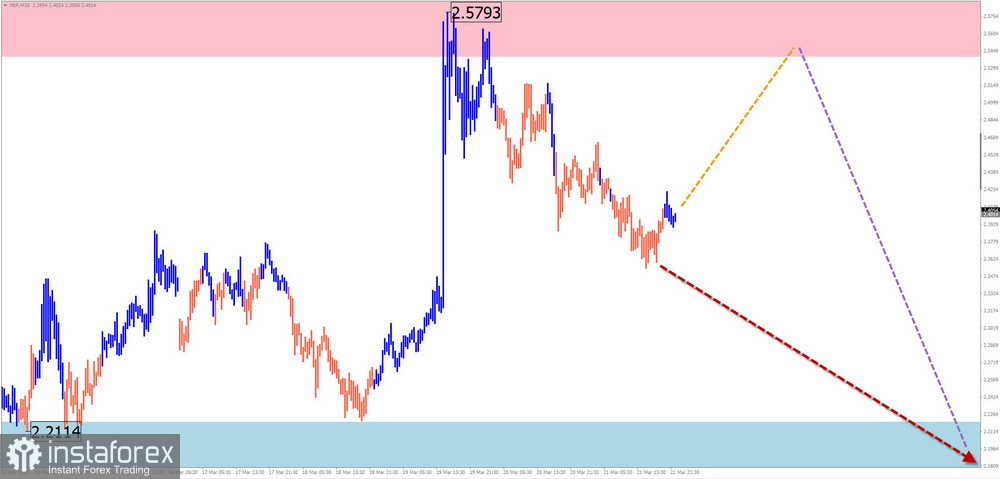
Ripple quotes are in a cluster of strong reversal levels across multiple chart scales. The prevailing downward wave (B) that began this month is still unfolding. Once complete, the short-term bearish trend is expected to continue.

Forecast:

This week, expect the upward movement to end, followed by a reversal in the resistance zone and a renewed downward move. Support marks the lower boundary of the week's range.

This image is no longer relevant

Potential Reversal Zones Resistance: 2.5400 / 2.5900 Support: 2.2200 / 2.1700

Recommendations:

  • Buying: May be used with reduced volume size in isolated sessions. Potential limited to resistance.
  • Selling: Valid after confirmed reversal signals near the resistance zone.

Notes: In Simplified Wave Analysis (SWA), all waves consist of 3 parts (A-B-C). Only the most recent unfinished wave is analyzed on each timeframe. Dotted lines indicate projected movements.

Warning: The wave algorithm does not account for the duration of price movements over time.

EURUSD
Euro vs US Dollar
Summary
Buy
Urgency
1 week
Analytic
Vyacheslav Ognev
Start trade
Gana con los cambios en el valor de las criptomonedas con InstaForex.
Descarga MetaTrader 4 y abre tu primera operación.
  • Grand Choice
    Contest by
    InstaForex
    InstaForex always strives to help you
    fulfill your biggest dreams.
    UNIRSE AL CONCURSO

Recommended Stories

NG 12 Feb. ¡Los toros mantienen el rumbo hacia un máximo de 4,31!

El marco temporal de cuatro horas muestra el trazado de una onda activa principal (Y), que tiene una forma interna compleja y es un doble zigzag de un nivel

Roman Onegin 07:26 2025-02-12 UTC+2

SP500 12 de febrero. ¡Después de la finalización de la segunda parte del impulso, el precio puede subir más activamente!

Lo más probable es que se esté formando una tendencia alcista mayor en el panorama global del SP500, cuya estructura es similar a la del impulso. Si nos fijamos

Roman Onegin 07:26 2025-02-12 UTC+2

Análisis del par EUR/USD. El 7 de julio. ¿Dónde se encuentra la raíz de todos los problemas del dólar?

El conteo de ondas en el gráfico de 4 horas para el instrumento EUR/USD permanece sin cambios. Actualmente estamos observando la formación de la supuesta onda

Chin Zhao 15:58 2024-07-07 UTC+2

Análisis del par EUR/USD. El 6 de julio. El destino complicado del dólar.

El conteo de ondas en el gráfico de 4 horas para el instrumento EUR/USD permanece sin cambios. Actualmente estamos observando la formación de la supuesta onda

Chin Zhao 15:57 2024-07-07 UTC+2

Análisis del par GBP/USD. El 6 de julio. La libra quiere caer, pero no puede.

La estructura de ondas del instrumento GBP/USD sigue siendo bastante complicada y muy confusa. Alrededor del nivel de 1.2822, que corresponde al 23.6% de Fibonacci y está cerca del pico

Chin Zhao 15:57 2024-07-07 UTC+2

Análisis del par GBP/USD. El 22 de junio. El mercado espera la primera bajada de los tipos de interés en agosto.

El patrón de onda para el instrumento GBP/USD sigue siendo bastante complicado y confuso. Un intento exitoso de romper el nivel de Fibonacci del 50,0% en abril indicó

Chin Zhao 13:12 2024-06-22 UTC+2

Análisis del par EUR/USD. El 22 de junio. La Fed: No está lista para el aterrizaje.

En el gráfico de 4 horas, no hay cambios en la marca de la onda para el instrumento EUR/USD. En este momento, observamos la construcción de la esperada onda

Chin Zhao 10:51 2024-06-22 UTC+2

Análisis del par GBP/USD. El 8 de junio. Los británicos retrocedieron, pero no se rindieron.

El patrón de onda para el instrumento GBP/USD sigue siendo bastante complicado. El intento exitoso de romper el nivel de Fibonacci del 50,0% en abril indicó que el mercado está

Chin Zhao 08:27 2024-06-09 UTC+2

Análisis del par EUR/USD. El 8 de junio. El BCE confía en una mayor desaceleración de la inflación.

El patrón de onda del gráfico de 4 horas para el instrumento EUR/USD se mantiene sin cambios. En este momento, estamos observando la construcción de la onda esperada

Chin Zhao 08:26 2024-06-09 UTC+2

EUR/USD. Análisis del 2 de octubre. Las estadísticas europeas vuelven a decepcionar y el euro vuelve a caer

El análisis de ondas del gráfico de 4 horas para el par euro/dólar sigue siendo bastante claro. Durante el año pasado, solo hemos visto tres estructuras onduladas que se alternan

Chin Zhao 17:48 2023-10-02 UTC+2
¿No puede hablar ahora mismo?
Ingrese su pregunta en el chat.
Widget callback
 

Dear visitor,

Your IP address shows that you are currently located in the USA. If you are a resident of the United States, you are prohibited from using the services of InstaFintech Group including online trading, online transfers, deposit/withdrawal of funds, etc.

If you think you are seeing this message by mistake and your location is not the US, kindly proceed to the website. Otherwise, you must leave the website in order to comply with government restrictions.

Why does your IP address show your location as the USA?

  • - you are using a VPN provided by a hosting company based in the United States;
  • - your IP does not have proper WHOIS records;
  • - an error occurred in the WHOIS geolocation database.

Please confirm whether you are a US resident or not by clicking the relevant button below. If you choose the wrong option, being a US resident, you will not be able to open an account with InstaForex anyway.

We are sorry for any inconvenience caused by this message.