

signal strength 4 of 5
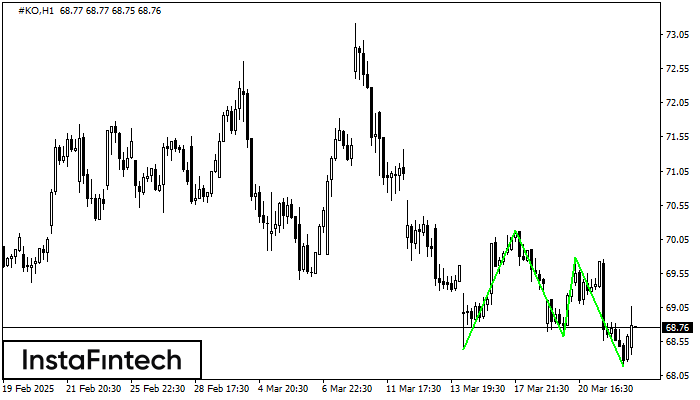
The Triple Bottom pattern has formed on the chart of #KO H1. Features of the pattern: The lower line of the pattern has coordinates 70.18 with the upper limit 70.18/69.78, the projection of the width is 175 points. The formation of the Triple Bottom pattern most likely indicates a change in the trend from downward to upward. This means that in the event of a breakdown of the resistance level 68.43, the price is most likely to continue the upward movement.
Vea asimismo
- All
- Double Top
- Flag
- Head and Shoulders
- Pennant
- Rectangle
- Triangle
- Triple top
- All
- #AAPL
- #AMZN
- #Bitcoin
- #EBAY
- #FB
- #GOOG
- #INTC
- #KO
- #MA
- #MCD
- #MSFT
- #NTDOY
- #PEP
- #TSLA
- #TWTR
- AUDCAD
- AUDCHF
- AUDJPY
- AUDUSD
- EURCAD
- EURCHF
- EURGBP
- EURJPY
- EURNZD
- EURRUB
- EURUSD
- GBPAUD
- GBPCHF
- GBPJPY
- GBPUSD
- GOLD
- NZDCAD
- NZDCHF
- NZDJPY
- NZDUSD
- SILVER
- USDCAD
- USDCHF
- USDJPY
- USDRUB
- All
- M5
- M15
- M30
- H1
- D1
- All
- Buy
- Sale
- All
- 1
- 2
- 3
- 4
- 5
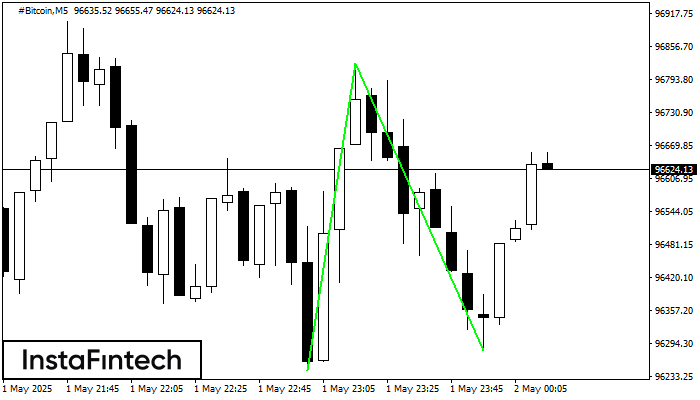
Сформирована фигура «Двойное дно» на графике #Bitcoin M5. Данное формирование сигнализирует об изменении тенденции с нисходящего на восходящее движение. Сигнал: Торговую позицию на покупку следует открывать после пробоя верхней границы
Таймфреймы М5 и М15 могут иметь больше ложных точек входа.
Открыть график инструмента в новом окне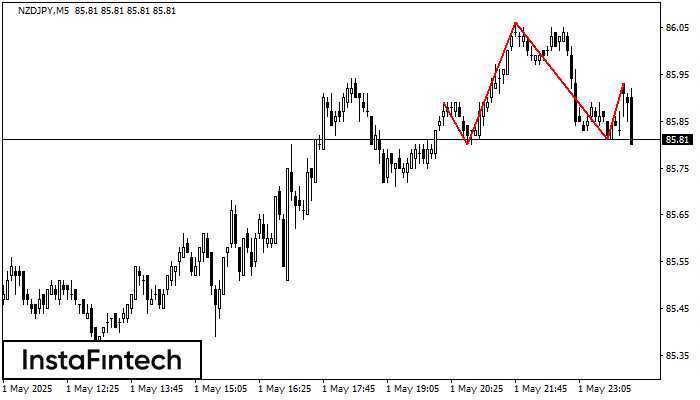
Графическая фигура «Голова и плечи» сформировалась по инструменту NZDJPY на M5. Вероятно предполагать, что после формирования правого плеча цена преодолеет уровень шеи 85.80/85.81, изменяя тем самым тенденцию и фактически направляя
Таймфреймы М5 и М15 могут иметь больше ложных точек входа.
Открыть график инструмента в новом окне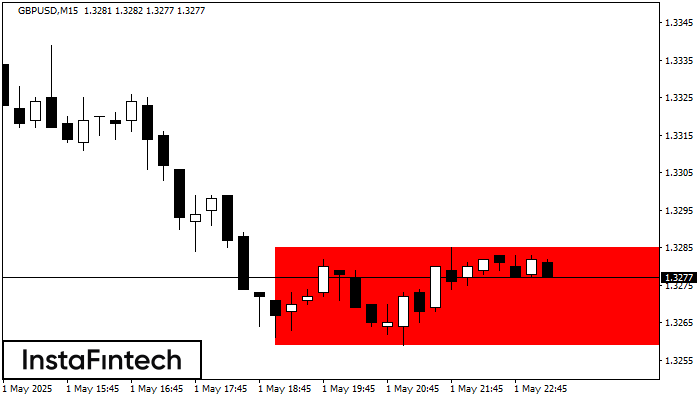
Сформирована фигура «Прямоугольник» на графике GBPUSD M15. Тип фигуры: Продолжение тренда; Границы: Верхняя 1.3285, Нижняя 1.3259; Сигнал: позиция на продажу открывается после фиксации цены ниже границы прямоугольника 1.3259
Таймфреймы М5 и М15 могут иметь больше ложных точек входа.
Открыть график инструмента в новом окне


