empty
was formed on 28.03 at 09:30:34 (UTC+0)
signal strength 3 of 5
Double Bottom NZDUSD M30

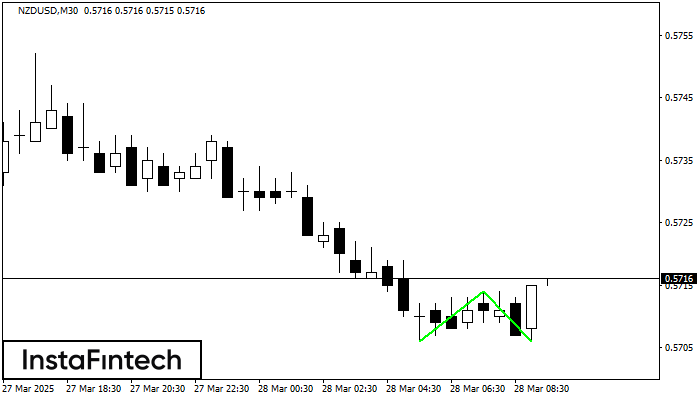
The Double Bottom pattern has been formed on NZDUSD M30. This formation signals a reversal of the trend from downwards to upwards. The signal is that a buy trade should be opened after the upper boundary of the pattern 0.5714 is broken. The further movements will rely on the width of the current pattern 8 points.

Vea asimismo

Figure
  • All
  • Double Top
  • Flag
  • Head and Shoulders
  • Pennant
  • Rectangle
  • Triangle
  • Triple top
Instrument
  • All
  • #AAPL
  • #AMZN
  • #Bitcoin
  • #EBAY
  • #FB
  • #GOOG
  • #INTC
  • #KO
  • #MA
  • #MCD
  • #MSFT
  • #NTDOY
  • #PEP
  • #TSLA
  • #TWTR
  • AUDCAD
  • AUDCHF
  • AUDJPY
  • AUDUSD
  • EURCAD
  • EURCHF
  • EURGBP
  • EURJPY
  • EURNZD
  • EURRUB
  • EURUSD
  • GBPAUD
  • GBPCHF
  • GBPJPY
  • GBPUSD
  • GOLD
  • NZDCAD
  • NZDCHF
  • NZDJPY
  • NZDUSD
  • SILVER
  • USDCAD
  • USDCHF
  • USDJPY
  • USDRUB
Timeframe
  • All
  • M5
  • M15
  • M30
  • H1
  • D1
Trend
  • All
  • Buy
  • Sale
Signal Strength
  • All
  • 1
  • 2
  • 3
  • 4
  • 5
Double Bottom
was formed on 02.04 at 18:55:21 (UTC+0)
signal strength 1 of 5
Double Bottom #PEP M5

The Double Bottom pattern has been formed on #PEP M5; the upper boundary is 150.16; the lower boundary is 148.41. The width of the pattern is 175 points. In case

The M5 and M15 time frames may have more false entry points.

Open chart in a new window
Double Bottom
was formed on 02.04 at 18:55:02 (UTC+0)
signal strength 1 of 5
Double Bottom #PEP M5

The Double Bottom pattern has been formed on #PEP M5. Characteristics: the support level 148.41; the resistance level 150.16; the width of the pattern 175 points. If the resistance level

The M5 and M15 time frames may have more false entry points.

Open chart in a new window
Bullish Symmetrical Triangle
was formed on 02.04 at 18:45:06 (UTC+0)
signal strength 2 of 5
Bullish Symmetrical Triangle #MA M15

According to the chart of M15, #MA formed the Bullish Symmetrical Triangle pattern. The lower border of the pattern touches the coordinates 539.13/544.19 whereas the upper border goes across 550.97/544.19

The M5 and M15 time frames may have more false entry points.

Open chart in a new window
¿No puede hablar ahora mismo?
Ingrese su pregunta en el chat.
Widget callback
 

Dear visitor,

Your IP address shows that you are currently located in the USA. If you are a resident of the United States, you are prohibited from using the services of InstaFintech Group including online trading, online transfers, deposit/withdrawal of funds, etc.

If you think you are seeing this message by mistake and your location is not the US, kindly proceed to the website. Otherwise, you must leave the website in order to comply with government restrictions.

Why does your IP address show your location as the USA?

  • - you are using a VPN provided by a hosting company based in the United States;
  • - your IP does not have proper WHOIS records;
  • - an error occurred in the WHOIS geolocation database.

Please confirm whether you are a US resident or not by clicking the relevant button below. If you choose the wrong option, being a US resident, you will not be able to open an account with InstaForex anyway.

We are sorry for any inconvenience caused by this message.