empty
was formed on 25.03 at 06:55:19 (UTC+0)
signal strength 1 of 5
Inverse Head and Shoulder NZDCAD M5

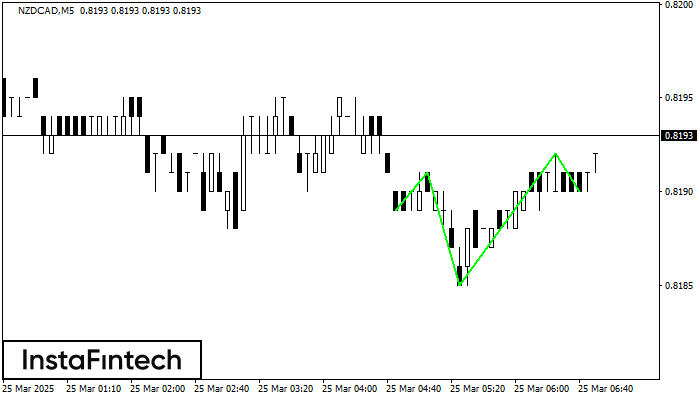
According to M5, NZDCAD is shaping the technical pattern – the Inverse Head and Shoulder. In case the Neckline 0.8191/0.8192 is broken out, the instrument is likely to move toward 0.8207.

The M5 and M15 time frames may have more false entry points.

ดูเพิ่มเติม

Figure
  • All
  • Double Top
  • Flag
  • Head and Shoulders
  • Pennant
  • Rectangle
  • Triangle
  • Triple top
Instrument
  • All
  • #AAPL
  • #AMZN
  • #Bitcoin
  • #EBAY
  • #FB
  • #GOOG
  • #INTC
  • #KO
  • #MA
  • #MCD
  • #MSFT
  • #NTDOY
  • #PEP
  • #TSLA
  • #TWTR
  • AUDCAD
  • AUDCHF
  • AUDJPY
  • AUDUSD
  • EURCAD
  • EURCHF
  • EURGBP
  • EURJPY
  • EURNZD
  • EURRUB
  • EURUSD
  • GBPAUD
  • GBPCHF
  • GBPJPY
  • GBPUSD
  • GOLD
  • NZDCAD
  • NZDCHF
  • NZDJPY
  • NZDUSD
  • SILVER
  • USDCAD
  • USDCHF
  • USDJPY
  • USDRUB
Timeframe
  • All
  • M5
  • M15
  • M30
  • H1
  • D1
Trend
  • All
  • Buy
  • Sale
Signal Strength
  • All
  • 1
  • 2
  • 3
  • 4
  • 5
รูปแบบกราฟจุดสองยอดขาลง (Double Bottom)
was formed on 31.03 at 13:01:22 (UTC+0)
signal strength 3 of 5
รูปแบบกราฟจุดสองยอดขาลง (Double Bottom) NZDCAD M30

รูปแบบ รูปแบบกราฟจุดสองยอดขาลง (Double Bottom) ถูกสร้างขึ้นมาใน NZDCAD M30 คุณลักษณะ: ระดับของแนวรับ 0.8149; ระดับของแนวต้าน 0.8192; ความกว้างของรูปแบบ 43 จุด

Open chart in a new window
รูปแบบกราฟจุดสามยอดขาลง (Triple Bottom)
was formed on 31.03 at 13:00:03 (UTC+0)
signal strength 3 of 5
รูปแบบกราฟจุดสามยอดขาลง (Triple Bottom) GBPJPY M30

รูปแบบ รูปแบบกราฟจุดสามยอดขาลง (Triple Bottom) ได้ถูกสร้างขึ้นมาใน GBPJPY M30 มันมี คุณลักษณะ ดังต่อไปนี้: ระดับแนวต้าน 193.38/193.33; ระดับของแนวรับ 192.71/192.75; ความกว้างคือ

Open chart in a new window
รูปแบบกราฟจุดสามยอดขาลง (Triple Bottom)
was formed on 31.03 at 12:45:37 (UTC+0)
signal strength 2 of 5
รูปแบบกราฟจุดสามยอดขาลง (Triple Bottom) GBPJPY M15

รูปแบบ รูปแบบกราฟจุดสามยอดขาลง (Triple Bottom) ได้สร้างขึ้นมาในชาร์ตของ GBPJPY M15 ที่เป็นตราสารการซื้อขาย รูปแบบนี้แสดงถึงการเปลี่่ยนแปลงในแนวโน้มจากแนวโน้มขาลง ไปเป็นแนวโน้มขาขึ้น ในกรณีที่มีการเคลื่อนตัวทะลุผ่านที่ 193.38/193.33

ขอบเตระยะเวลาใน M5 และ M15 อาจจะมีตำแหน่งการเข้าใช้งานที่ผิดพลาดมากยิ่งขึ้น

Open chart in a new window
หากไม่สะดวกคุยในตอนนี้
ระบุคำถามไว้ได้ใน แชท.
Widget callback
 

Dear visitor,

Your IP address shows that you are currently located in the USA. If you are a resident of the United States, you are prohibited from using the services of InstaFintech Group including online trading, online transfers, deposit/withdrawal of funds, etc.

If you think you are seeing this message by mistake and your location is not the US, kindly proceed to the website. Otherwise, you must leave the website in order to comply with government restrictions.

Why does your IP address show your location as the USA?

  • - you are using a VPN provided by a hosting company based in the United States;
  • - your IP does not have proper WHOIS records;
  • - an error occurred in the WHOIS geolocation database.

Please confirm whether you are a US resident or not by clicking the relevant button below. If you choose the wrong option, being a US resident, you will not be able to open an account with InstaForex anyway.

We are sorry for any inconvenience caused by this message.