сила сигнала 2 из 5
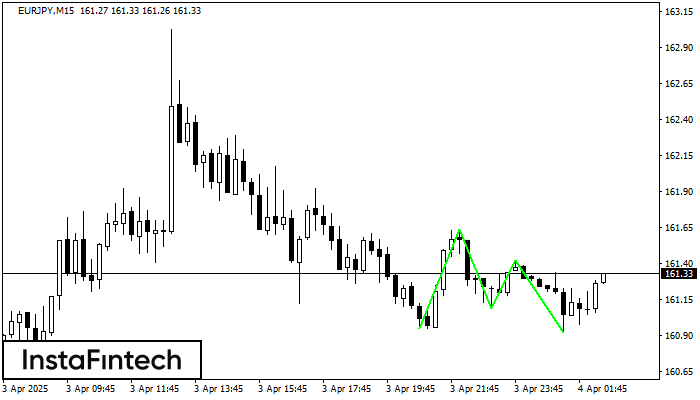
По EURJPY на M15 сформировалась фигура «Тройное дно». Характеристика: Нижняя граница фигуры имеет координаты 160.92, при этом верхняя граница 161.64/161.42. Проекция ширины 55 пунктов. Формирование фигуры «Тройное дно» наиболее вероятным образом свидетельствует об изменении тренда с нисходящего на восходящий. Это означает, что в случае пробоя нижней границы 160.92 курс, с наибольшей вероятностью, продолжит восходящее движение.
Таймфреймы М5 и М15 могут иметь больше ложных точек входа.
Дивіться також
- Все
- Вымпел
- Голова и плечи
- Двойная вершина
- Прямоугольник
- Треугольник
- Тройная вершина
- Флаг
- Все
- #AAPL
- #AMZN
- #Bitcoin
- #EBAY
- #FB
- #GOOG
- #INTC
- #KO
- #MA
- #MCD
- #MSFT
- #NTDOY
- #PEP
- #TSLA
- #TWTR
- AUDCAD
- AUDCHF
- AUDJPY
- AUDUSD
- EURCAD
- EURCHF
- EURGBP
- EURJPY
- EURNZD
- EURRUB
- EURUSD
- GBPAUD
- GBPCHF
- GBPJPY
- GBPUSD
- GOLD
- NZDCAD
- NZDCHF
- NZDJPY
- NZDUSD
- SILVER
- USDCAD
- USDCHF
- USDJPY
- USDRUB
- Все
- M5
- M15
- M30
- H1
- D1
- Все
- Покупка
- Продажа
- Все
- 1
- 2
- 3
- 4
- 5
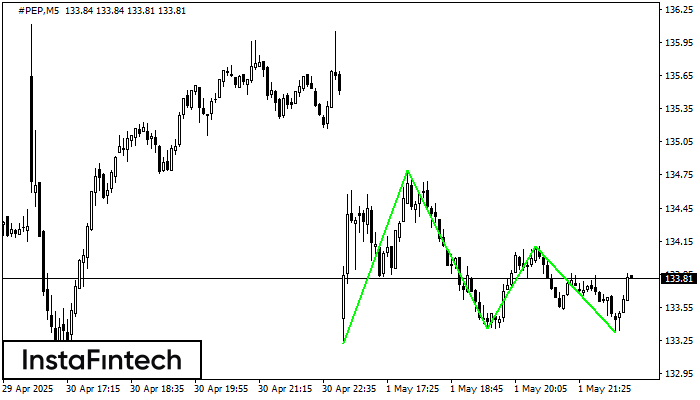
The Triple Bottom pattern has been formed on #PEP M5. It has the following characteristics: resistance level 134.79/134.10; support level 133.22/133.32; the width is 157 points. In the event
The M5 and M15 time frames may have more false entry points.
Open chart in a new window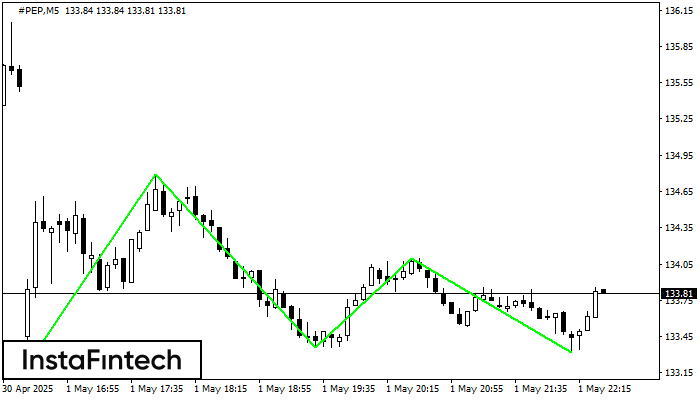
The Triple Bottom pattern has formed on the chart of #PEP M5. Features of the pattern: The lower line of the pattern has coordinates 134.79 with the upper limit 134.79/134.10
The M5 and M15 time frames may have more false entry points.
Open chart in a new window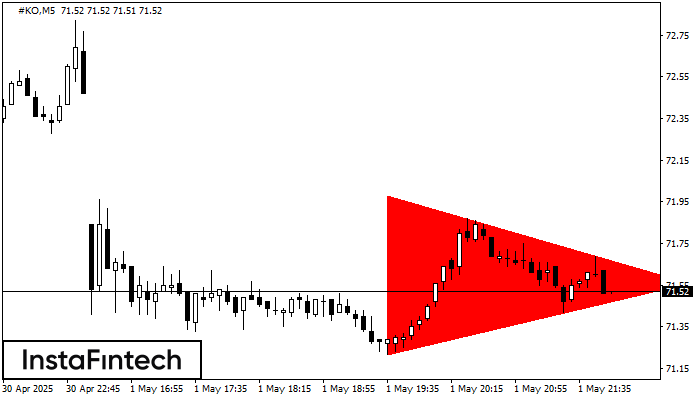
According to the chart of M5, #KO formed the Bearish Symmetrical Triangle pattern. This pattern signals a further downward trend in case the lower border 71.22 is breached. Here
The M5 and M15 time frames may have more false entry points.
Open chart in a new window